Defined benefit universe projection model
This report presents the results associated with TPR’s DB universe projection model (the model), which models various scenarios as to how the occupational defined benefit (DB) universe may evolve over the next 10 years. The model and results presented are based on data on our systems at 31st March 2025.
The projection is deterministic under a single set of economic assumptions, and output is limited to 10 years. The paper examines six scenarios to help with the interpretation of results and to explore different future paths.
1. Introduction
As at 31 March 2025, there were around 4,700 private sector occupational defined benefit (DB) pension schemes holding estimated assets of around £1.1 trillion and promising pensions to around 9 million savers. Most are gradually maturing towards the point where all members are retired and receiving pensions, although there remains a small but financially significant number of schemes who remain open to new entrants.
In recent years, the overall DB landscape funding position has changed significantly. The focus for most DB schemes has changed from being one of recovering deficits and trying to reach full funding on a technical provisions basis, to being fully funded on technical provisions and having a focus on long-term ‘end game’ strategies. In this respect, we estimate that, as at 31 March 2025, over half of all DB schemes are estimated to be in surplus on a buy-out basis.
The Pensions Schemes Bill 2025 introduces policies allowing trustees of well-funded schemes to extract and share surplus. It also establishes a legislative framework for superfunds. Legislation is not expected to be in place in either case for a few years and some of the detail is yet to be developed.
These legislative changes mean more schemes, especially those that are larger in size and immature, are now considering ‘running on’ in the intermediate future. Other schemes, of all sizes, may be considering transferring to a consolidator such as a superfund or insuring their liabilities and winding up.
The bulk purchase annuity (BPA) market is also thriving, with 2024 seeing a record number of transactions amidst new entrants providing more choice for pension schemes across all segments of the market (for smaller and larger schemes).
The potential evolution of the DB market is of material interest to TPR from a regulatory perspective. It will influence matters such as the guidance we issue, the conversations we wish to have with trustees and their advisers, the concerns we may have and the monitoring we should consider over potential systemic issues.
The Pension Insights and Modelling team have therefore modelled 10-year projections of the DB landscape under various scenarios with the aim of drawing out insights into the following:
- The current funding of schemes and how this will evolve.
- The impact on the evolution of the universe from:
- maturity
- schemes choosing to run-on, and potentially distributing surplus
- the buy-in and buy-out market
- the superfund market
- The impact on total assets in the DB universe and implications for different asset classes.
TAS compliance
This report is a condensed version of the internal TPR report that has been prepared on the basis that it will be published externally. It has been written on the basis that decisions will not be based on its contents.
This report, and the work undertaken to produce it, complies with Technical Actuarial Standard 100 (TAS 100) v2.0, as published by the Financial Reporting Council (FRC). TAS 100 v2.0 applies to technical actuarial work (as defined in Section 4 of TAS 100 v2.0) that is completed on or after 1 July 2023.
2.1 Background
To gain a comprehensive understanding of how schemes view their longer-term strategies, we engaged with actuarial industry contacts advising over 75% of DB schemes (by liabilities). We also spoke with an insurance company that has carried out multiple deals with schemes over many years.
The discussions covered both larger and smaller schemes. While the definition of large schemes varies over the industry, most consultants consider this to mean schemes with assets more than £100m, and often more than around £250 million.
These discussions offered valuable insights which are summarised in the sections below on Buy-out market, Run-on, Superfunds and Predictions for the next decade.
2.2 Buy-out market
Capacity and constraints
The buy-out market is expected to remain robust over the next five to six years, with annual demand from pension schemes estimated at around £40 billion to £50 billion in liabilities. This could rise to £60 billion, although the actual size of the market is highly sensitive to the timing and presence of large schemes coming to market. In terms of transaction volume, 2024 was a record year with nearly 300 deals completed. Volumes are expected to increase again to approximately 350 in 2025, driven in part by a growing number of smaller scheme transactions.
Insurer capacity has expanded significantly in recent years, supported by new entrants and the broadening of existing propositions. As a result, insurers can accommodate schemes ranging from as small as £1 million to as large as £20 billion, with healthy competition from insurers across all scheme sizes.
Some limitations remain. Schemes above £5 billion may need to phase their buy-ins over several years, partly due to insurers’ challenges in sourcing suitable assets. Other market constraints include the quality and readiness of scheme data, as well as personnel capacity.
The transition from buy-in to buy-out now typically takes around three to four years. This timeframe has lengthened recently due to industry-wide resource pressures. It is estimated that more than 500 schemes are currently awaiting conversion from buy-in to buy-out.
Scheme appetite
Trustees continue to view insurance as a premium solution, especially for schemes lacking the scale or resources to run on. Around half of large schemes , are expected to pursue buy-ins over the next five years, while the remainder may opt to run on. In some cases, schemes have already shifted from buy-out to run-on strategies, aiming to use surplus funds for alternative purposes such as providing defined contribution (DC) benefits.
While occasional concerns are raised about the security of the insurer regime, these have not significantly deterred schemes from pursuing insurance solutions. Buy-ins are typically seen as a transitional step toward full buy out. Accounting treatment plays a key role in the decision to buy in or run on – particularly for schemes reporting under US accounting standards – where buy-ins can have material impacts on the profits declared in the year of transaction.
Pricing and Assets
Insurer pricing is currently seen as very competitive, particularly for mature and smaller schemes. Although smaller schemes may face a slight premium per member compared to larger ones, they are generally more expensive to run on when looked at on a ‘per member’ basis, making buy-out relatively more cost-effective.
The high level of competition in the market has led to a disconnect between pricing and credit spreads. Looking ahead, no significant changes in pricing are anticipated.
While competition has expanded for smaller schemes, they still need to consider exclusivity contracts – where a scheme works with a single insurer rather than broking across the market – as exclusivity can still offer benefits, and schemes should weigh the cost of broking against the potential impact on pricing.
Schemes preparing for buy-in or buy-out typically adopt asset strategies designed to hedge pricing and funding positions. These may include 25% to 50% corporate bonds, along with matching assets and cash. Illiquid assets such as private equity or infrastructure can pose challenges unless the scheme is very large.
Most buy-ins are transacted in cash, as insurers generally prefer to select their own assets rather than accept assets in specie. Insurer asset strategies vary but may include around 20% gilts and 25% to 50% corporate bonds. Although some insurers are currently backing new deals with higher proportions of gilts, which are more capital-efficient under current conditions.
Longevity Swaps
The longevity swap market remains niche, with only 5 to 10 transactions occurring annually. This is not expected to change significantly in the near term. These swaps are typically suitable only for larger schemes, with a minimum size of around £1 billion. Pricing is approximately 1% of liabilities, and the longevity reinsurance market is highly competitive.
Longevity swaps may become more attractive if the run-on market gains traction, as they can help mitigate tail risks and facilitate more efficient or equitable surplus distribution. However, schemes planning to buy out within five years are generally advised against entering longevity swaps. Insurers prefer using their own longevity reinsurance, and the costs associated with both setting up and exiting a swap can make it uneconomical in such cases.
2.3. Run-on
The viability of a run-on strategy varies significantly across schemes, with size being a key determinant. For many small schemes, running on is not economically attractive due to the fixed costs that are largely independent of scheme size. These costs can outweigh any potential benefits.
Schemes that do consider running on are likely to view it as an intermediate step – perhaps over a 10-year period – as the scheme matures. This approach can lead to more favourable buy-out pricing and a gradual reduction in liabilities over time. Very few schemes are expected to run on until the last member dies.
Run-on strategies can be attractive under certain conditions. Schemes generally need to be at least £100 million in size, with serious consideration being given by those over £1 billion. Economically, run-on may be beneficial, particularly for US-based sponsors due to the accounting treatment of buy-outs. It may also appeal to schemes holding significant illiquid assets.
Beyond financial considerations, run-on offers flexibility in funding defined contribution (DC) sections, awarding discretionary benefits, enhancing member experience, and retaining governance oversight. For employers, it provides the opportunity to access surplus on an ongoing basis, which can be used to strengthen the employer covenant both in the short and long term.
Surplus extraction under a run-on model presents challenges. Trustees are likely to be cautious, preferring to maintain a buffer above low dependency, with some schemes likely to target solvency plus a margin to reduce the risk of underfunding and future contribution requirements. There is also uncertainty around how surplus assets should be shared, which may depend upon scheme rules, the size of the funding buffer, contribution history, and negotiations between stakeholders.
Several barriers to run-on remain. These include the asymmetry in funding responsibilities, where employers usually bear the full downside risk but only share upside potential with members.
There are also concerns about potential future changes in legislation or regulation. Additionally, surplus refunded to the employer cannot be offset against trading losses for tax purposes, which may reduce its appeal.
From an investment perspective, run-on requires a degree of risk-taking to generate ongoing surplus. This will be linked to the size of any buffer held and the risk of underfunding. Overall asset strategies are expected to resemble those used by insurers – typically a mix of credit, gilts, and illiquids – suggesting no material difference from schemes targeting buy-out.
2.4 Superfunds
Superfunds
There remains significant uncertainty surrounding the evolution and potential of the superfund market. However, recent developments, particularly the Pension Schemes Bill, have increased dialogue around superfunds and provided greater clarity regarding the timelines for establishing a legislative framework.
At present, only one superfund is operating and authorised by TPR. Nonetheless, expectations are that additional superfunds will enter the market, offering alternative proposals. These could create opportunities for schemes to run on and potentially share surplus releases with members, sponsors, and investors. For employers, superfunds offer the advantage of a quicker exit from scheme liabilities compared to the traditional insurance market.
In the current market, there is a perception that schemes need to have assets exceeding £50 million to be considered attractive, primarily due to the costs involved. However, there is demand from smaller schemes, and if the market develops further, superfunds may be expected to broaden their appetite to schemes of all sizes. There is no upper limit on scheme size from a superfund perspective.
The significant consideration for trustees is the balance between member security and potential benefits, which might include the sharing of any profit-release. For large schemes with weaker sponsoring covenants and limited access to the buy-out market, superfunds may present a viable alternative.
Bridge-to-buy-out models will require a consistent pipeline of schemes, although this market is currently shrinking due to significant improvements in buy-out funding levels and increasingly attractive insurer pricing.
There may be innovation opportunities for small schemes to use superfunds as a solution to enable run-on and access surplus for members.
Until the superfund market becomes more established, it remains difficult to predict whether pension schemes will embrace superfunds as a credible alternative to insurance solutions. Given this uncertainty, we have instead developed a scenario in which there are a material number of superfund transactions, for those schemes that meet the superfund onboarding requirements to understand how this impacts the DB sector.
2.5 Predictions for the next decade
Our industry engagement suggests that the market over the next ten years will undergo significant transformation. But there remains significant uncertainty around the number of large schemes electing to run on, the amount and distribution of any surplus extracted, and the development of the superfund market.
Given these uncertainties, we have modelled several scenarios that show the impact of higher and lower levels of buy-out transactions, run-on and surplus distribution and evolution of the superfund market. These scenarios show a potential range of how the DB market may evolve over the next 10 years and the differing impacts on the DB market and impact for members and employers.
3. Data, methodology and assumptions
3.1 Data
To produce the projections from 31 March 2025, the following data was used:
- Scheme funding data we have collected as at 31 March 2025. This data is based on the information provided to us from the 2025 DB annual scheme return and recovery plan submissions received up to that date.
- External data sources as follows:
- The estimated UK nominal spot curve and UK implied inflation spot curve as at 31 March 2025, produced by the Bank of England.
- Market indices data obtained from London Stock Exchange Group (LSEG) in order to estimate assets as at 31 March 2025.
- Office for National Statistics (ONS) estimates of benefit outgo , contributions in respect of future accrual and deficit repair contributions.
- Covenant gradings on our systems as at 31 March 2025.
- The output of the TPR actuarial roll-forward model, run as at 31 March 2025. This provides us with estimated assets and liabilities at 31 March 2025 for each scheme in the data set above.
- The output of the actuarial liability cashflow model run as at 31 March 2025. This provides us with the estimated future cashflows used in the model for each scheme in the data set above.
Checks on data
The raw scheme data and model outputs have been subject to actuarial data checks which look to highlight key outliers and are adjusted as necessary. We exclude a small number of schemes that, because of data issues, will not run through the model. The data used makes no allowance for updates made to scheme returns or data on our systems after 31 March 2025.
We are content that the data used in the model is appropriate to provide results regarding the potential universe evolution in aggregate from 31 March 2025.
31 March 2025: the starting position for our projections
As at 31 March 2025, there were around 4,700 private sector occupational DB schemes, holding estimated assets of £1.1 trillion. This is split in line with scheme status as follows:
- 4% schemes with 15% estimated assets are open to new entrants.
- 19% schemes with 35% assets are closed to new members but open to accrual.
- 77% schemes with 50% assets are closed to new entrants and future accrual.
52% of these schemes are estimated to be in surplus on a buy-out basis.
Total aggregate annual benefit payments to members are around £50 billion per annum. Contributions in respect of future accrual are around £7 billion per annum.
Total direct and indirect holdings of nominal and index linked UK government bonds of £540 billion.
Aggregate universe asset splits as at 31 March are estimated as follows:
|
Conventional gilts |
Index-linked gilts |
Corporates |
Growth |
Other |
Cash and ABCs |
Annuities |
|---|---|---|---|---|---|---|
|
18% |
31% |
16% |
18% |
14% |
-11% |
13% |
Note: Growth includes equities, absolute return funds and diversified growth funds. Other includes private debt, sub-investment grade bonds and property. May not sum to 100% due to rounding.
The tables below show our estimates of DB scheme numbers and total assets by buy-out funding level and total assets as at 31 March 2025.
|
Less than 80% |
80 to 95% |
95 to 100% |
100 to 125% |
Greater than 125% |
Total |
|||||||
|---|---|---|---|---|---|---|---|---|---|---|---|---|
|
Row Labels |
Number |
Assets £billion |
Number |
Assets £billion |
Number |
Assets £billion |
Number |
Assets £billion |
Number |
Assets £billion |
Number |
Assets £billion |
|
0 to 100 million |
514 |
10 |
878 |
24 |
339 |
8 |
1,178 |
26 |
727 |
11 |
3,636 |
80 |
|
100 million to 1billion |
78 |
19 |
248 |
74 |
120 |
41 |
297 |
95 |
122 |
39 |
865 |
268 |
|
1billion+ |
6 |
11 |
52 |
249 |
21 |
81 |
76 |
288 |
46 |
127 |
201 |
755 |
|
Total |
598 |
40 |
1,178 |
346 |
480 |
130 |
1,551 |
409 |
895 |
177 |
4,702 |
1,102 |
Source: Actuarial roll-forward model v17.1 output 31.03.2025
As seen above, we estimate the following as at 31 March 2025:
- Schemes that have assets under management (AUM) of under £100 million account for 77% (3,636) of the overall universe by number but only 7% (£80 billion) by AUM.
- By contrast, schemes that have AUM of over £1 billion, account for only 4% (201) of the overall universe by number but by 69% (£755 billion) by AUM.
- 2,446 schemes (£586 billion AUM) are fully funded on a buy-out basis and so are now eligible for buy-out with-out any further employer contributions.
- A further 1,658 schemes (£476 billion AUM) are greater than 80% funded on a buy-out basis, for whom these might reach fully funded on a buy-out basis over our 10-year projection.
3.2 Methodology
Using output from the TPR roll forward and cashflow models – along with assumptions for future investment allocations, returns, market pricing, accrual, contributions, behavioural and other assumptions – the model projects forward each scheme on an individual basis under a single set of deterministic assumptions for 10 years in annual steps from the calculation date.
For each scheme the model projects, for each future year, estimates of the expected:
- asset values and splits by asset class and how these may change in the future
- liabilities on technical provision (TP), buy-out and low dependency bases
- contributions in and benefits paid (meaning the expected net asset outflow)
- duration of scheme liabilities
This projection is then overlaid with assumptions regarding trustee and employer behaviours and market capacity to project the impact of scheme exits to insurance and consolidators, and also of schemes running on and distributing surpluses. We model the following exits from the projected universe:
- Schemes ‘running on’ and distribution of surplus on an ongoing basis that allows for both lump sum payments and benefit enhancement.
- Schemes buying in and subsequently buying out after three years with an insurance company, and any surplus on transaction distributed that allows for both a lump sum payment and benefit enhancement.
- Schemes transferring to a superfund.
Our approach is to model each scheme individually (we individually pick which schemes will run-on or target insurance or consolidation). We then rank those schemes in order of preference to determine which ones we assume transact each year (subject to capacity constraints). To do this, for each scheme, we consider:
- its open or closed status
- whether it is hybrid
- whether it has a US parent
- its illiquid asset holdings
- its duration
- its funding level
- its size
- its data quality
Once a scheme reaches buy-out status, it no longer forms part of our modelling universe.
Many assumptions are needed including:
- the buy-in or buy-out market demand and capacity in terms of size of assets, number of transactions each year and the time taken to transition from buy-in to buy-out
- the superfund market demand, capacity and eligibility criteria
- which schemes may wish to run on, for how long and the investment approach taken
- the criteria for any distribution of surplus, and when this may be taken and how distributed between members and employers
The significant change in the funding position of DB schemes over the last few years, alongside the evolving landscape and potential attractiveness of different endgame options, mean that past data or experience does not provide a suitable evidence base with which to set forward looking assumptions in respect of trustee behaviour and endgame strategies. This is especially true when considering a 10-year projection period.
A range of reasonable assumptions and scenarios exist. We have modelled six different scenarios with assumptions set using judgement informed by:
- our estimates of the current number, size, and funding positions of schemes in the DB universe
- engagement with industry specialists across a range of consultancies and insurers (see section 2 Industry Views)
3.3. Scenarios and assumptions
For the purpose of this report, ‘small schemes’ means schemes with assets less than £100 million as at 31 March 2025 and ‘large schemes’ means schemes with assets more than £250 million as at 31 March 2025.
The scenarios modelled are set out below at a high level.
Run 1: base projection
The base projection assuming all schemes run-on with no scheme exits and no surplus extraction.
Run 2: technical provisions surplus used to fund accruals
Technical provision surplus is used to fund accruals for open and open to accrual schemes, and no further schemes exit or permit surplus extraction.
Run 3: run-on scenario 1 (50% run on)
50% of large schemes (greater than £250 million) run on for 10 years, surplus extraction is 50% benefit uplift and 50% paid out immediately as lump sum whilst none of the small schemes (less than £100 million) run on except those that are open or immature and open to accrual.
Run 4: run on scenario 2 (25% run on)
25% of large schemes (greater than £250 million) run on for 10 years, surplus extraction is 50% benefit uplift and 50% paid out immediately as lump sum while none of the small schemes (less than £100 million) run on except those that are open or immature and open to accrual.
Run 5: run on scenario 3 (75% run on)
75% of large schemes ( greater than £250 million) run on for 10 years, surplus extraction is 50% benefit uplift and 50% paid out immediately as lump sum whilst none of the small schemes (less than £100m) run on expect those that are open or immature and open to accrual.
Run 6: superfund scenario
From 2026, around 350 schemes conduct a superfund transaction. These are broadly 33% of schemes that we assume are not running on and are less than £1 billion in size with buy-out funding level between 80% to 100% plus a small number of £1 billion plus schemes.
Additional information
Run 1 provides our base position if there is no change in the number of schemes in the DB universe. It shows purely the impact of maturity on the projected landscape with no allowance for using scheme surplus.
Run 2 shows the impact of open schemes funding future accrual through existing and emerging TP surplus.
Runs 3 to 5 consider the impact on the evolution of the universe of endgame decision making, specifically whether schemes pursue a strategy to run-on and distribute surplus or pursue an insurance transaction.
- At the smaller end of the market (less than £250m) we assume that the estimated 2025 insurance transaction volumes remain stable over the 10-year period, this applies under all 3 runs.
- For small schemes (less than £100m) we assume that all schemes will enter an insurance transaction when funding permits except those schemes that are open or are immature and open to accrual.
- The proportion of schemes that will choose to run on and extract surplus is uncertain. We therefore model the current market view (50% large schemes and some of the smaller schemes) and bookend with 2 sensitivities around higher and lower levels of run on.
- We model surplus distribution with the surplus that is extracted set with regards to a buffer of 5% above buy-out funding. We assume schemes access all surplus over this buffer in full during the projection period and model 50% of the surplus removed as an immediate lump sum payment and 50% used to enhance member benefits.
Run 6 considers the impact of the emergence of a significant superfund market.
- Run 6 imagines a scenario whereby the superfund market develops and is attractive to schemes up to £1 billion (and a small number of £1 billion+ schemes with a weak sponsor covenant).
- In this scenario we model the superfund market developing from 2026 (prior to when legislation is expected to be in force) and that 33% of schemes who are targeting buy-out who are less than £1 billion in size instead enter a superfund transaction subject to being within 80% to100% of buy-out funding levels. The number of transactions per annum is limited to a maximum 150.
- It is assumed that the number of insurance market transactions can continue in line with the assumptions from run 3.
Further sensitivities
We also consider 7 further sensitivities to Run 3 as described below.
Run 3.1: smaller surplus buffer sensitivity
With the buffer over buy-out surplus reduced to 0%.
Run 3.2: larger surplus buffer sensitivity
With the buffer over buy-out surplus increased to 10%.
Run 3.3: run-on surplus: 100% lump sum
With surplus extraction 100% paid out immediately as lump sum.
Run 3.4: run-on surplus: 100% member benefits
With surplus extraction 100% paid out as benefit uplift.
Run 3.5: 15% schemes running on access surplus
Only 15% of schemes that run on actively distribute surplus.
Run 3.6: 50% schemes running on access surplus
Only 50% of schemes that run on actively distribute surplus.
Run 3.7: fall in buy-out pricing sensitivity
Buy-out prices fall by 5% in year 2+.
Run 3.8: increase in buy-out pricing sensitivity
Buy-out prices increase by 5% in year 2+.
Run 3.9: increase in insurer gilt holdings sensitivity
Insurers back new BPA liabilities with 40% gilts.
Runs 3.1 and 3.2 investigate uncertainty around the level at which surplus may be extracted for schemes running on, by considering the impact of different buffers over buy-out funding. For all the runs looking at surplus extraction and buffer levels, we have applied a level of smoothing of surplus release over the first 3 years from 2028 rather than assume that the maximum is all taken immediately in 2028.
Runs 3.3 and 3.4 investigate uncertainty around how extracted surplus may be distributed, by considering the impact of removing 100% from the universe by way of lump sum payments, or by using 100% to uplift member benefits.
Runs 3.5 and 3.6 investigate uncertainty around the level of surplus that may be extracted by considering the impact of different proportions of schemes running on that actively distribute surplus. In these sensitivities, a proportion of the surplus is retained within schemes.
Runs 3.7 and 3.8 investigate uncertainty over future insurer pricing, by considering the impact of changes in buy-out pricing. We have assumed that the current pricing remains for the first year and that changes apply thereafter.
Some insurers are currently backing new BPA liabilities with higher proportions of gilts than the long term expected position (which we have modelled for the other runs). Run 3.7 models the impact of insurers maintaining this strategy over the projection period.
4. Model output and discussion
4.1 Summary
The figures shown below in tables 1 to 4 are in 31 March 2025 money terms. They have been adjusted to allow for assumed consumer price index (CPI) inflation over the projection period (real).
Table 1 summarises the following:
- The universe of occupational DB pension schemes as at 31 March 2025.
- The projected position of the universe of occupational DB pension schemes as at 31 March 2035 under each scenario 1 to 6. They include:
- the number of DB schemes
- total Assets
- total liabilities on a technical provisions, low dependency and buy-out basis
Table 2 summarises the following over the period to 31 March 2035:
- The number of schemes who undertake transactions in respect of:
-
- buy-ins (insurance transactions)
- superfunds
- buy-outs (the conversion of the buy-in to buy-out) and therefore exit from the occupational DB sector into the insurance sector
- The size (£ amount) of the anticipated transactions in respect of:
-
- surplus used by open schemes to cover the cost of accrual
- surplus used by schemes to provide discretionary awards to members
- buy-ins
- surplus at the point of buy-in used to provide discretionary awards to members
- superfund transfers
- refund of surplus paid by schemes as a lump sum payment
- refund of surplus at the point of buy-in paid by schemes as a lump sum payment
- conversion of buy-in policies to buy-out
Items (d) to (h) show the size of transactions for which assets are retained in the occupational DB scheme sector, whereas items (i) to (k) show the size of assets that exit the occupational DB sector, as either payments to employers (or members) or through the conversion of buy-ins to the insurance sector (buy-out).
Tables 3 and 4, are a repeat of tables 1 and 2 (above) but show the sensitivity of the results from run 3 of amending the various assumptions in respect of:
- the size of buffer before distributing surplus (3.1 and 3.2)
- how surplus is distributed (lump sum or benefit enhancement) (3.3 and 3.4)
- the proportion of schemes pursuing a run on strategy that actively distribute surplus (3,5 and 3.6)
- the cost of buy-ins (3.7 and 3.8)
Further results in nominal terms are shown in the Appendix 1: nominal results.
Table 1: Projected TPR DB universe at 31 March 2035 (inflation adjusted) - Runs 1 to 6
TPR regulatory universe
| 31 March 2025 |
Run 1 |
Run 2 |
Run 3 |
Run 4 |
Run 5 |
Run 6 |
|
|---|---|---|---|---|---|---|---|
|
Number of schemes |
4,702 |
4,702 |
4,702 |
2,288 |
2,233 |
2,369 |
2,346 |
|
Assets (£ billion real) |
1,102 |
963 |
922 |
616 |
564 |
674 |
622 |
|
Technical provisions (£ billion real) |
935 |
698 |
698 |
548 |
504 |
598 |
553 |
|
Low dependency (£ billion real) |
999 |
739 |
739 |
587 |
542 |
639 |
593 |
|
Buy-out liabilities (£ billion real) |
1,073 |
782 |
782 |
623 |
577 |
677 |
628 |
Projected DB transactions over 31 March 2025 to 31 March 2035 (inflation adjusted) - Runs 1 to 6
Table 2a: number of schemes
|
Run 1 |
Run 2 |
Run 3 |
Run 4 |
Run 5 |
Run 6 |
|||
|---|---|---|---|---|---|---|---|---|
|
Buy-ins |
- |
- |
2,498 |
2,607 |
2,401 |
2,338 |
||
|
Superfund |
- |
- |
0 |
0 |
0 |
326 |
||
|
Exits from TPR Universe (Buy-outs) |
- |
- |
(2,414) |
(2,469) |
(2,333) |
(2,356) |
||
Table 2b: transactions within TPR Universe (£ billion)
|
Run 1 |
Run 2 |
Run 3 |
Run 4 |
Run 5 |
Run 6 |
|||
|---|---|---|---|---|---|---|---|---|
|
Run-on: surplus used for accrual |
- |
33 |
30 |
30 |
30 |
30 |
||
|
Run-on: surplus used for benefit increases |
- |
- |
32 |
20 |
45 |
32 |
||
|
Buy-ins |
- |
- |
256 |
379 |
167 |
244 |
||
|
Buy-ins: surplus used for benefit increases |
- |
- |
26 |
40 |
13 |
26 |
||
|
Superfund |
- |
- |
0 |
0 |
0 |
35 |
||
Table 2c: exits from TPR Universe (£ billion)
|
Run 1 |
Run 2 |
Run 3 |
Run 4 |
Run 5 |
Run 6 |
|||
|---|---|---|---|---|---|---|---|---|
|
Run-on: surplus paid as lump sum |
- |
- |
(32) |
(20) |
(45) |
(32) |
||
|
Buy-ins: surplus paid as lump sum |
- |
- |
(26) |
(40) |
(13) |
(26) |
||
|
Buy-outs |
- |
- |
(250) |
(309) |
(184) |
(245) |
||
|
Total exits from TPR Universe |
- |
- |
(308) |
(370) |
(242) |
(303) |
||
Table 3: Sensitivity: Projected TPR DB universe at 31 March 2035 (inflation adjusted) - Runs 3 to 3.8
TPR regulatory universe
|
Run 3 |
Run 3.1 |
Run 3.2 |
Run 3.3 |
Run 3.4 |
Run 3.5 |
Run 3.6 |
Run 3.7 |
Run 3.8 |
||
|---|---|---|---|---|---|---|---|---|---|---|
|
Number of schemes |
2,288 |
2,288 |
2,288 |
2,288 |
2,288 |
2,288 |
2,288 |
2,159 |
2,413 |
|
|
Assets (£ billion real) |
616 |
606 |
624 |
595 |
636 |
658 |
640 |
584 |
635 |
|
|
Technical Provisions (£ billion real) |
548 |
552 |
545 |
530 |
566 |
533 |
539 |
531 |
552 |
|
|
Low Dependency (£ billion real) |
587 |
592 |
584 |
568 |
607 |
571 |
578 |
570 |
591 |
|
|
Buy-out Liabilities (£ billion real) |
623 |
627 |
619 |
603 |
642 |
606 |
613 |
574 |
658 |
|
Sensitivity: Projected DB transactions over 31 March 2025 to 31 March 2035 (inflation adjusted) - Runs 3 to 3.8
Table 4a: number of schemes
|
Run 3 |
Run 3.1 |
Run 3.2 |
Run 3.3 |
Run 3.4 |
Run 3.5 |
Run 3.6 |
Run 3.7 |
Run 3.8 |
|||
|---|---|---|---|---|---|---|---|---|---|---|---|
|
Buy-ins |
2,498 |
2,498 |
2,509 |
2,498 |
2,498 |
2,498 |
2,498 |
2,693 |
2,286 |
||
|
Superfund |
0 |
0 |
0 |
0 |
0 |
0 |
0 |
0 |
0 |
||
|
Exits from TPR universe (buy-outs) |
(2,414) |
(2,414) |
(2,414) |
(2,414) |
(2,414) |
(2414) |
(2414) |
(2,543) |
(2,289) |
||
Table 4b: transactions within TPR universe (£ billion)
|
Run 3 |
Run 3.1 |
Run 3.2 |
Run 3.3 |
Run 3.4 |
Run 3.5 |
Run 3.6 |
Run 3.7 |
Run 3.8 |
|||
|---|---|---|---|---|---|---|---|---|---|---|---|
|
Run-on: surplus used for accrual |
30 |
28 |
30 |
30 |
30 |
30 |
30 |
27 |
31 |
||
|
Run-on: surplus used for benefit increases |
32 |
38 |
26 |
0 |
63 |
5 |
16 |
38 |
26 |
||
|
Buy-ins |
256 |
256 |
256 |
256 |
256 |
256 |
256 |
277 |
237 |
||
|
Buy-ins: surplus used for benefit increases |
26 |
26 |
26 |
26 |
26 |
26 |
26 |
30 |
21 |
||
|
Superfund |
0 |
0 |
0 |
0 |
0 |
0 |
0 |
0 |
0 |
||
Table 4c: exits from TPR Universe (£ billion)
|
Run 3 |
Run 3.1 |
Run 3.2 |
Run 3.3 |
Run 3.4 |
Run 3.5 |
Run 3.6 |
Run 3.7 |
Run 3.8 |
|||
|---|---|---|---|---|---|---|---|---|---|---|---|
|
Run-on: surplus paid as lump sum |
(32) |
(38) |
(26) |
(64) |
(0) |
(5) |
(16) |
(38) |
(26) |
||
|
Buy-ins: surplus paid as lump sum |
(26) |
(26) |
(26) |
(26) |
(26) |
(26) |
(26) |
(30) |
(21) |
||
|
Buy-outs |
(250) |
(250) |
(250) |
(250) |
(250) |
(250) |
(250) |
(267) |
(245) |
||
|
Total exits from TPR universe |
(308) |
(315) |
(303) |
(341) |
(277) |
(282) |
(293) |
(335) |
(293) |
||
4.2 Run 1: base projection
Run 1 – Our base position if there is no change in the number of schemes in the DB universe
In the absence of any ’exits‘ from the DB universe, our base projection (Run 1) shows the impact of the universe maturing. Between 31 March 2025 and 31 March 2035:
- total assets increase in nominal terms by 18% to £1.3 trillion and fall in real terms by 13% to £1.0 trillion
- total liabilities on buy-out, technical provision and low dependency bases remain broadly level in nominal terms and fall in real terms by around 25%
- number of schemes in the universe that are fully funded on a buy-out basis estimated to increase from around 50% to around 75% of schemes as at 31 March 2035, with the projected net buy-out surplus increasing from around £30billion to around £180billion (real)
Asset splits
Under our base projection, asset splits are projected to remain fairly stable over the 10-year projection. asset de-risking is having little impact at the universe level. We assume no de-risking for schemes currently holding growth assets making up less than 20% of their total assets, and no de-risking for open schemes. Together, these account for around 81% of universe AUM as at 31 March 2025.
| Bucket | Estimated at 31 March 2025 | Projected at 31 March 2035 |
|---|---|---|
| Conventional gilts | 18% | 18% |
| Index-linked gilts | 31% | 33% |
| Corporates | 16% | 18% |
|
Growth |
18% | 19% |
|
Other |
14% | 14% |
| Cash and asset-backed contributions (ABC)s | -11% | -10% |
| Annuities | 13% | 8% |
‘Growth’ includes equities, absolute return funds and diversified growth funds.
‘Other’ includes private debt, sub investment grade bonds and property.
4.3 Run 2: technical provision surplus funds accrual
Run 2 – Schemes open to new members or accrual use surplus to fund future accrual
Run 2 shows that open schemes funding future accrual through existing and emerging technical provision surplus reduces projected total aggregate assets as at 31 March 2035 by around a further £50 billion (nominal) or £40 billion (real) from those projected under our base projection. As this only affects the assets, the liability projections are unchanged from Run 1.
Our modelling assumes that all surplus for open schemes above technical provisions is used to fund accrual. In practice, any use of surplus will depend on the rules of the scheme, negotiations between trustees and employer, whether a buffer is retained to avoid future contributions for potential underfunding or due to changes in investment strategy or funding strategy.
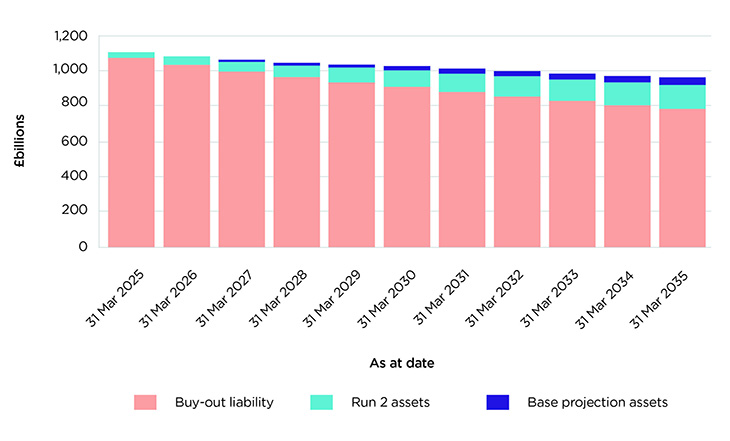
The graph below shows projected assets and buy out liabilities (in real terms) as at 31 March each year for the 10-year projection, under Run 2 and the change in projected assets from Run 1.
Figure 1: projected universe assets and buy out liabilities. TP surplus funds accrual. £ billion (real)
4.4. Runs 3, 4 and 5: buy-out, run on and surplus
Exits
Transaction Volumes
All three runs show a shortfall in the number and value of annual transactions (buy-ins) in the later part of the projection period compared to our assumptions. This is because, for all runs, we begin to run out of schemes that meet our criteria for wanting to transact (targeting buy-out and being buy-out funded).
As illustrated in the table and graphs below, this is the case for all scheme sizes but is most noticeable in our asset projections for large schemes.
The table below shows the projected number of buy-in transactions each year under runs 3, 4 and 5.
Projected annual buy-in transactions (number of schemes)
|
Run 3 |
Run 4 |
Run 5 |
||||||||||
|---|---|---|---|---|---|---|---|---|---|---|---|---|
|
Date |
Under £100m |
£100m-£1billion |
Over £1billion |
Total |
Under £100m |
£100m-£1billion |
Over £1billion |
Total |
Under £100m |
£100m-£1billion |
Over £1billion |
Total |
|
Mar 25 to 26 |
290 |
50 |
11 |
351 |
290 |
50 |
11 |
351 |
290 |
50 |
11 |
351 |
|
Mar 26 to 27 |
290 |
50 |
10 |
350 |
290 |
50 |
10 |
350 |
290 |
49 |
10 |
349 |
|
Mar 27 to 28 |
290 |
50 |
10 |
350 |
290 |
50 |
11 |
351 |
290 |
33 |
7 |
330 |
|
Mar 28 to 29 |
290 |
48 |
10 |
348 |
290 |
50 |
10 |
350 |
290 |
32 |
0 |
322 |
|
Mar 29 to 30 |
237 |
42 |
12 |
291 |
237 |
50 |
13 |
300 |
237 |
30 |
3 |
270 |
|
Mar 30 to 31 |
193 |
37 |
8 |
238 |
193 |
50 |
12 |
255 |
193 |
33 |
1 |
227 |
|
Mar 31 to 32 |
201 |
12 |
2 |
215 |
201 |
28 |
13 |
242 |
201 |
10 |
1 |
212 |
|
Mar 32 to 33 |
193 |
8 |
2 |
203 |
193 |
20 |
11 |
224 |
193 |
4 |
0 |
197 |
|
Mar 33 to 34 |
69 |
13 |
5 |
87 |
69 |
22 |
10 |
101 |
69 |
11 |
2 |
82 |
|
Mar 34 to 35 |
53 |
11 |
1 |
65 |
53 |
20 |
10 |
83 |
53 |
8 |
0 |
61 |
|
Total |
2,106 |
321 |
71 |
2,498 |
2,106 |
390 |
111 |
2,607 |
2,106 |
260 |
35 |
2,401 |
The graph below shows the projected volume of total buy-in transactions (£ billion) each year under runs 3, 4 and 5.
Figure 2: projected annual buy ins £ billion (real)
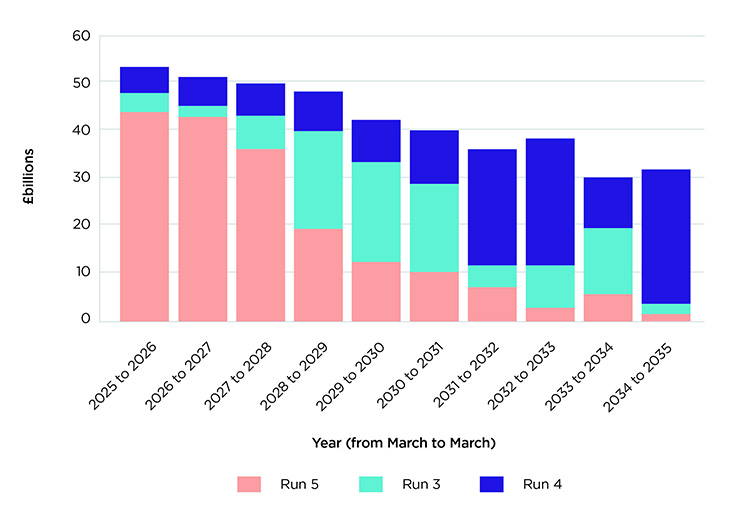
Read the text alternative of figure 2: projected annual buy ins £ billion (real)
Impact of Large Scheme Behaviour
The decision by large schemes to either buy out or run on is the dominant driver of the total volume (in GBP) of insurance transactions over the 10-year projection period.
- In Run 4, where only 25% of large schemes run on, insurance activity is highest, with total buy-in liabilities of around £420 billion (real) (of which around £40 billion arises from surplus distributed as an uplift to member benefits – see below).
- Conversely, Run 5, with 75% of large schemes running on, sees a significant reduction in buy-in volumes with total liabilities of around £180 billion (real) (of which around £10 billion arises from surplus distributed as an uplift to member benefits).
- Run 3 sits between these extremes, highlighting the sensitivity of the BPA market to large scheme decisions.
Note that while our projections estimate transaction volumes on a yearly basis, we do not have access to detailed market data that would allow us to forecast the timing of large scheme transactions accurately. Instead, we assume that the buy-in market capacity for large schemes – both in terms of the number and value of transactions – remains broadly consistent with estimated 2025 levels.
For those not running on, we assume they will enter into an insurance transaction when funding allows with the order of preference as defined above. In practice, the actual timing of buy-in transactions will depend on the specific circumstances of each scheme.
For the purposes of this report, the cumulative volume of transactions is therefore more informative than the year-by-year pattern.
Buy-outs
Projected buy-out volumes over the 10 years reflect the number of schemes assumed as full scheme buy-ins at 31 March 2025, projected buy-in volumes over the 10-year projection and the assumed three-year delay between buy-in and buy-out:
- Run 3: around 2,400 schemes with total liabilities of around £250 billion (real) convert to buy-outs.
- Run 4: around 2,500 schemes with total liabilities of around £310 billion (real) convert to buy-outs.
- Run 5: around 2,300 schemes with total liabilities of around £180 billion (real) convert to buy-outs.
Note the implicit assumption here that there is capacity within the market to process over 2,500 buy-outs to buy-ins (including those already in the queue) over the 10 years.
Surplus Extraction
Total surplus extraction over the 10-year projection is at similar levels across all 3 runs, but the source reflects the proportion of large schemes assumed to run-on or buy-out.
- Run 3 estimates surplus extraction of around £50 billion (real) at the point of buy-in, and around £60 billion (real) from schemes running on
- Run 4 estimates around £80 billion (real) from buy-ins, and around £40 billion (real) from schemes running on. Reflecting the greater number of large scheme buy-ins
- Run 5 estimates around £30 billion (real) from buy-ins and around £90 billion (real) from schemes running on
In each case, we assume schemes access all surplus over the buffer in full during the projection period, and surplus is split evenly between enhancing member benefits and lump sum extraction.
Projected TPR universe
The TPR regulatory universe includes buy-in annuities, superfunds and other consolidation vehicles, but excludes buy-outs.
Actual volumes of scheme exits to insurance and patterns and levels of surplus distribution (in particular, for the large schemes), are the primary additional drivers of the projected reduction in size of the DB universe over the next 10 years.
Impact of exits
Run 3 shows that between 31 March 2025 and 31 March 2035:
- assets fall by 25% to around £0.8 trillion (nominal) and by 44% to around £0.6 trillion (real)
- liabilities reduce by around 20% (nominal) and by around 40% (real) on buy-out, technical provision and low dependency bases
- scheme numbers fall by around 50% to around 2,300, of which around 400 are full scheme buy-ins (projected to buy-out within the following 3 years)
- around 1,700 of the remaining schemes are ‘small’
- around 50% are fully funded on a buy-out basis as at 31 March 2035
- insurance BPA liabilities grow by £0.3 trillion nominal or £0.2 trillion (real)
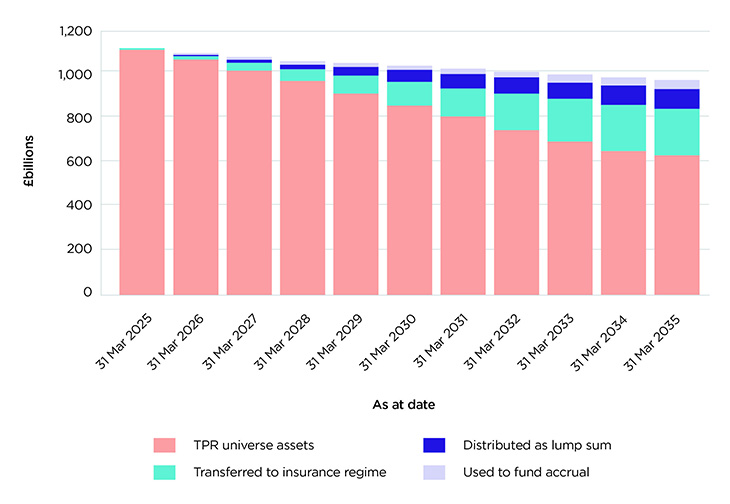
Figure 3: projected universe assets and buy out liabilities with no exits and no surplus extraction £ billion (real)
Run 4 assumes more insurance transactions (meaning fewer schemes remain in the DB universe). Compared to Run 3, at 31 March 2035:
- assets fall further: by 31% to around £0.8 trillion (nominal) or 49% to around £0.6 trillion (real)
- liabilities fall further: by around 30% (nominal) or around 45% (real)
- scheme numbers fall further to around 2,200 (of which around 400 are buy-ins)
- BPA liabilities increase more: to £0.4 trillion nominal or £0.3 trillion (real)
- net impact: Reduction of around £50 billion assets (real) and around £50 billion liabilities (real) from Run 3
Run 5 assumes fewer insurance transactions (meaning more schemes remain in the DB universe) compared to Run 3, at 31 March 2035:
- assets fall less: by 18% to around £0.9 trillion (nominal) / 39% to around £0.7 trillion (real).
- liabilities fall less: by around 15% (nominal) / around 35% (real).
- scheme numbers fall less to around 2,400 (of which around 300 are buy-ins)
- BPA liabilities increase less: to £0.2 trillion nominal / £0.1 trillion real
- net impact: Increase of around £60 billion assets (real) and around £50 billion liabilities (real) from Run 3
Further Sensitivities
Runs 3.1 and 3.2 – 5% Reduction and Increase in the Surplus Distribution Buffer
Run 3.1: Reducing the buffer above buy-out liabilities (over which schemes might distribute surplus) leads to an increase in total surplus distributed of around £12 billion (real). As a result, projected assets at 31 March 2035 fall by around £10 billion (real), while buy-out liabilities increase by around £4 billion.
Run 3.2: Increasing the buffer reduces the amount of surplus distributed by around £12 billion (real). This results in projected assets at 31 March 2035 increasing by around £8 billion (real) and buy-out liabilities falling by around £4 billion.
Runs 3.3 and 3.4 – Run-On Surplus: 100% Lump Sum and 100% Member benefit uplift
Run 3.3: If schemes pursuing a run on strategy distribute all surplus as a lump sum, both projected assets and liabilities at 31 March 2035 fall by around £20 billion (real).
Run 3.4: Where surplus is used entirely to uplift member benefits, projected assets and liabilities at 31 March 2035 both increase by around £20 billion (real).
Runs 3.5 and 3.6 – 15% and 50% of schemes running on access surplus
Run 3.5: If only 15% of schemes pursuing a run on strategy actively distribute surplus, the amount of surplus distributed falls by around £54 billion (real), to £10 billion (real). Projected assets at 31 March 2035 increase by around £42 billion (real) and projected buy-out liabilities fall by around £17 billion (real).
Run 3.6: If only 50% of schemes pursuing a run on strategy actively distribute surplus, the amount of surplus distributed falls by around £32 billion (real), to £32 billion (real). Projected assets at 31 March 2035 increase by around £24 billion (real) and projected buy-out liabilities fall by around £10 billion (real).
Runs 3.7 and 3.8 – 5% Decrease and Increase in BPA Pricing
Run 3.7: A 5% fall in BPA pricing leads to an increase in buy-in transactions – around an additional 200 schemes with £20 billion (real).
- projected assets at 31 March 2035 fall by around £30 billion (real)
- projected buy-out liabilities fall by around £50 billion (real), of which around £30 billion reflects the change in pricing and around £20 billion is from increased transactions
Run 3.8: A 5% increase in BPA pricing results in fewer transactions - around 200 fewer schemes with £20 billion (real).
- projected assets at 31 March 2035 increase by around £20 billion (real)
- projected buy-out liabilities increase by around £35 billion (real), of which around £30 billion reflects the change in pricing and around £5 billion is due to reduced transaction volumes
Asset splits and gilt demand
Projected asset splits under runs 3, 4 and 5 are shown below:
Projected at 31 March 2035
|
Bucket |
Estimated at 31 March 2025 |
Run 3 |
Run 4 |
Run 5 |
|---|---|---|---|---|
|
Conventional gilts |
18% |
17% |
16% |
18% |
|
Index-linked gilts |
31% |
31% |
28% |
33% |
|
Corporates |
16% |
16% |
14% |
17% |
|
Growth |
18% |
22% |
20% |
22% |
|
Other |
14% |
15% |
13% |
16% |
|
Cash and ABCs |
-11% |
-13% |
-12% |
-13% |
|
Annuities |
13% |
11% |
21% |
7% |
‘Growth’ includes equities, absolute return funds and diversified growth funds.
‘Other’ includes private debt, sub investment grade bonds and property.
Projected exits are mostly closed schemes, which tend to have smaller holdings of both growth assets, and of negative cash compared to the remaining open and open to accrual schemes with longer duration.
All 3 runs therefore shows a modest increase in the proportion of growth assets and level of leverage in the remaining TPR universe after 10 years.
Run 3 shows:
- the total value of direct and indirect holdings of nominal and index linked UK government bonds in the TPR Universe as around £300 billion (real) as at 31 March 2035
- the total value of annuities in the TPR Universe as around £70 billion (real) as at 31 March 2035
- an increase of around £210 billion (real) in insurer bulk purchase annuity liabilities as at 31 March 2035 as a result of projected full scheme buy-outs
- assuming insurers liabilities (buy-in annuities and buy-outs) are backed by 20% gilts this represents a further around £30 billion gilts as at 31 March 2025 and around £50 billion (real) gilts as at 31 March 2035
Combined this represents around £350 billion (real) gilts at 31 March 2035, so a reduction in gilt exposure in the assets supporting the current universe of member benefits of around £220 billion (in real terms) over 10 years (around 40%).
This projection also estimates the duration of direct and indirect holdings of nominal and index linked UK government bonds in the TPR Universe falls from 15.3 as at 31 March 2025 to 14.4 as at 31 March 2035, and reflects the schemes that are assumed to remain in the universe maturing over the 10-year projection.
Run 4 assumes more insurance transactions and therefore a reduction in gilt holdings from those in Run 3. Total gilt exposure, including gilts backing new BPA liabilities, is estimated at around £320 billion (real), so a reduction in gilt exposure in the assets supporting the current universe of member benefits of around £250 billion (real) over 10 years (around 45%).
Run 5 assumes fewer insurance transactions and therefore higher gilt holdings from those in Run 3. Total gilt exposure, including gilts backing new BPA liabilities, is estimated at around £380 billion (real), so a reduction in gilt exposure in the assets supporting the current universe of member benefits of around £190 billion (real) over 10 years (around 35%).
Sensitivity: Run 3.7 – Insurers back new BPA liabilities with 40% gilts
If we were instead to assume insurers were to back all annuity and buy-out liabilities with 40% gilts total gilt exposure, under Run 3, would rise to around £410 billion, so a reduction in gilt exposure in the assets supporting the current universe of member benefits of around £160 billion (in real terms) over 10 years (around 30%).
4.5 Run 6: superfund market
The previous scenarios only looked at the possibility of schemes running-on or conducting an insurance transaction. Since there retains uncertainty as to how the superfund market may develop and innovations with-in the market, it is difficult to make accurate predictions about the number of transactions. To understand how a meaningful superfund market might impact the DB sector over the next decade, we have derived a scenario in which the superfund market is considered to be an attractive and realistic alternative to the BPA market as a long-term solution for some schemes.
For these purposes we have assumed that some schemes that may be looking to buy out at some time in the future, instead transfer to a superfund. These schemes must also meet the onboarding conditions, which we have simplified to be only those schemes who can not afford the cost of buy out at the date of the superfund transaction. For simplicity, we have also assumed that such a market develops over the next year rather than wait until legislation is expected to come into effect during 2028.
We also assume that the emergence of a superfund market does not impact on the capacity of the insurance market, and that where remaining schemes meet the criteria for a buy-in then they will continue to buy-in (buy-out), and in many circumstances in our modelling this enables schemes to accelerate the time when they will be able to transact.
Were a superfund market to develop with sufficient capacity to take 33% of schemes we assume are not running on, with assets less than £1 billion (as at March 2025) and buy-out funding level between 80% and 100% (plus a small number of £1 billion+ schemes with a weak sponsor covenant), then run 6 estimates a total of around 300 superfund transactions over the 9 years from 31 March 2026 to 31 March 2035 with total liabilities on a buy-out basis of around £35 billion (real).
Since some of these transactions are in respect of schemes that we would otherwise project to transact with an insurer, total projected buy-ins over the 10-year projection fall from Run 3 by around 200 / around £10 billion.
Projected total buy-outs also fall. Although by a smaller amount due to the three-year period we model between buy-in and buy-out.
This can be seen in the following table that shows the separate number of transactions for buy-ins (and transfer to buy-out) and superfunds.
|
Run 3 |
Run 6 |
|||||
|---|---|---|---|---|---|---|
|
Date |
Buy-in |
Buy-out |
SF |
Buy-in |
Buy-out |
SF |
|
Mar 25 to 26 |
351 |
92 |
0 |
351 |
92 |
150 |
|
Mar 26 to 27 |
350 |
91 |
0 |
350 |
91 |
135 |
|
Mar 27 to 28 |
350 |
89 |
0 |
350 |
89 |
8 |
|
Mar 28 to 29 |
348 |
350 |
0 |
347 |
350 |
10 |
|
Mar 29 to 30 |
291 |
350 |
0 |
263 |
350 |
10 |
|
Mar 30 to 31 |
238 |
350 |
0 |
216 |
350 |
5 |
|
Mar 31 to 32 |
215 |
349 |
0 |
208 |
348 |
3 |
|
Mar 32 to 33 |
203 |
289 |
0 |
148 |
261 |
3 |
|
Mar 33 to 34 |
87 |
240 |
0 |
56 |
218 |
1 |
|
Mar 34 to 35 |
65 |
214 |
0 |
49 |
207 |
1 |
|
Total |
2,498 |
2,414 |
0 |
2,338 |
2,356 |
326 |
As run 6 assumes that superfunds are only available for schemes that are unable to transact with an insurer, due to funding levels with-in the DB scheme universe, there is a high degree of transactions for the first couple of years. However, capacity soon becomes limited (on the basis of the assumptions adopted in our modelling).
The total number of schemes projected to remain in the TPR universe as at 31 March 2035 is therefore higher than under Run 3 at around 2,300. Of these remaining schemes, around 1,700 are ‘small’ schemes (less than £100 million assets at 31 March 2025), of which there are around 500 who are projected to be within a superfund or in the process of buying out with an insurer.
Total assets in the TPR regulatory universe projected at 31 March 2025 increase from those in Run 3 by around £10 billion (real).
5. Reliances and limitations
The model results are based on market conditions and data as at 31 March 2025. The date of calculation affects the financial assumptions used to model scheme positions. It can have a material impact on the absolute values of liabilities, assets and hence deficits and deficit repair contributions (DRC)s estimated. If the modelling was carried out at a different date the results would vary.
Projections are highly sensitive to assumptions about trustee behaviour regarding long-term strategies for securing member benefits and market capacity. There remains significant uncertainty around the number of large schemes electing to run on, the amount and distribution of any surplus extracted, and the development of the superfund market. We model a range of scenarios, plausible based on conversations with industry, to show a range of outcomes.
The scenarios modelled imply nothing about how TPR considers future government policy should develop.
Endgame decisions are likely to be correlated with investment returns. Our model has just one deterministic set of assumptions used in all scenarios and, as such, it is not possible to draw out the implications of how alternative financial market conditions might impact the DB universe in the future.
Longevity risk is now the largest unhedged exposure for many DB schemes. Changes in life expectancy from that underpinning our projections could similarly have a material impact on funding positions and endgame decision-making. Similarly, we have not explored this in our projections.
The aim of the projections is to understand how the size and scale of the DB market may evolve over the next decade, principally due to scheme consolidation and surplus distribution. In doing so, we have not provided any further advice or analysis showing the impact of wider external factors. The risks associated with external factors are, in turn, likely to affect financial markets, scheme funding positions and trustee and employer behaviours regarding their long-term strategies. We think that excluding such analysis is proportionate given the narrow scope and purpose of this report.
The model is intended to provide results at an aggregate level over the total private occupational DB universe or large sub-groups of schemes and should not be used to draw conclusions for individual schemes.
The model relies on output from the TPR roll forward and cash flows models and a fundamental underlying assumption is that the output of these models can be used as input. This means that the approximations and limitations of those models also apply to the projection model, noting in particular limitations in DB universe data held by TPR.
Appendix: nominal results
Projected TPR DB universe at 31 March 2035: runs 1 to 6
TPR Regulatory Universe
| 31 March 25 |
Run 1 |
Run 2 |
Run 3 |
Run 4 |
Run 5 |
Run 6 |
|
|---|---|---|---|---|---|---|---|
|
Number of Schemes |
4,702 |
4,702 |
4,702 |
2,288 |
2,233 |
2,369 |
2,346 |
|
Assets (£ billion real) |
1,102 |
1,295 |
1,240 |
828 |
759 |
907 |
837 |
|
Technical Provisions (£ billion real) |
935 |
939 |
939 |
737 |
677 |
805 |
744 |
|
Low Dependency (£ billion real) |
999 |
994 |
994 |
790 |
729 |
860 |
797 |
|
Buy-out Liabilities (£ billion real) |
1,073 |
1,052 |
1,052 |
837 |
775 |
911 |
845 |
Projected DB transactions over 31 March 2025 to 31 March 2035: runs 1 to 6
Number of schemes
|
Run 1 |
Run 2 |
Run 3 |
Run 4 |
Run 5 |
Run 6 |
||
|---|---|---|---|---|---|---|---|
|
Buy-ins |
- |
- |
2,498 |
2,607 |
2,401 |
2,338 |
|
|
Superfund |
- |
- |
0 |
0 |
0 |
326 |
|
|
Exits from TPR Universe (Buy-outs) |
- |
- |
2,414 |
2,469 |
2,333 |
2,356 |
|
Transactions within TPR universe £ billion
|
Run 1 |
Run 2 |
Run 3 |
Run 4 |
Run 5 |
Run |
||
|---|---|---|---|---|---|---|---|
|
Run-on Surplus used for accrual |
- |
39 |
35 |
35 |
35 |
35 |
|
|
Run-on - Surplus used for benefit increases |
- |
- |
36 |
23 |
51 |
36 |
|
|
Buy-ins |
- |
- |
290 |
439 |
185 |
275 |
|
|
Buy-ins - Surplus used for benefit increases |
- |
- |
30 |
48 |
14 |
30 |
|
|
Superfund |
- |
- |
0 |
0 |
0 |
37 |
|
Exits from TPR Universe £ billion
|
Run 1 |
Run 2 |
Run 3 |
Run 4 |
Run 5 |
Run |
||
|---|---|---|---|---|---|---|---|
|
Run-on - Surplus paid as lump sum |
- |
- |
36 |
23 |
51 |
36 |
|
|
Buy-ins - Surplus paid as lump sum |
- |
- |
30 |
48 |
14 |
30 |
|
|
Buy-outs |
- |
- |
295 |
371 |
213 |
288 |
|
|
Total exits from TPR Universe |
- |
- |
362 |
442 |
278 |
355 |
|
Sensitivity: Projected TPR DB universe at 31 March 2035: runs 3 to 3.8
TPR regulatory universe
|
Run 3 |
Run 3.1 |
Run 3.2 |
Run 3.3 |
Run 3.4 |
Run 3.5 |
Run 3.6 |
Run 3.7 |
Run 3.8 |
|||||
|---|---|---|---|---|---|---|---|---|---|---|---|---|---|
|
Number of Schemes |
2,288 |
2,288 |
2,288 |
2,288 |
2,288 |
2,288 |
2,288 |
2,159 |
2,413 |
||||
|
Assets (£ billion real) |
828 |
815 |
840 |
800 |
856 |
885 |
861 |
786 |
855 |
||||
|
Technical Provisions (£ billion real) |
737 |
742 |
733 |
712 |
762 |
716 |
725 |
714 |
743 |
||||
|
Low Dependency (£ billion real) |
790 |
796 |
786 |
764 |
816 |
768 |
777 |
766 |
794 |
||||
|
Buy-out Liabilities (£ billion real) |
837 |
843 |
833 |
811 |
864 |
815 |
825 |
772 |
885 |
||||
Sensitivity: Projected DB transactions over 31 March 2025 to 31 March 2035: runs 3 to 3.8
Number of schemes
|
Run 3 |
Run 3.1 |
Run 3.2 |
Run 3.3 |
Run 3.4 |
Run 3.5 |
Run 3.6 |
Run 3.7 |
Run |
|||
|---|---|---|---|---|---|---|---|---|---|---|---|
|
Buy-ins |
2,498 |
2,498 |
2,498 |
2,498 |
2,498 |
2,498 |
2,498 |
2,693 |
2,286 |
||
|
Superfund |
0 |
0 |
0 |
0 |
0 |
0 |
0 |
0 |
0 |
||
|
Exits from TPR Universe (Buy-outs) |
2,414 |
2,414 |
2,414 |
2,414 |
2,414 |
2,414 |
2,414 |
2,543 |
2,289 |
||
Transactions within TPR Universe £ billion
|
Run 3 |
Run 3.1 |
Run 3.2 |
Run 3.3 |
Run 3.4 |
Run 3.5 |
Run 3.6 |
Run 3.7 |
Run 3.8 |
|||
|---|---|---|---|---|---|---|---|---|---|---|---|
|
Run-on Surplus |
35 |
33 |
35 |
35 |
35 |
35 |
35 |
33 |
36 |
||
|
Run-on - Surplus |
36 |
44 |
30 |
0 |
72 |
6 |
19 |
44 |
30 |
||
|
Buy-ins |
290 |
290 |
290 |
290 |
290 |
290 |
290 |
315 |
266 |
||
|
Buy-ins - Surplus |
30 |
30 |
30 |
30 |
30 |
30 |
30 |
35 |
24 |
||
|
Superfund |
0 |
0 |
0 |
0 |
0 |
0 |
0 |
0 |
0 |
||
Exits from TPR Universe £ billion
|
Run 3 |
Run 3.1 |
Run 3.2 |
Run 3.3 |
Run 3.4 |
Run 3.5 |
Run 3.6 |
Run 3.7 |
Run 3.8 |
|||
|---|---|---|---|---|---|---|---|---|---|---|---|
|
Run-on - Surplus |
36 |
44 |
30 |
73 |
0 |
6 |
19 |
44 |
30 |
||
|
Buy-ins - Surplus |
30 |
30 |
30 |
30 |
30 |
30 |
30 |
35 |
24 |
||
|
Buy-outs |
295 |
295 |
295 |
295 |
295 |
295 |
295 |
318 |
289 |
||
|
Total exits from |
362 |
370 |
356 |
399 |
326 |
332 |
345 |
396 |
344 |
||
Appendix 2: text alternatives
Figure 1: Projected universe assets and buy out liabilities. TP surplus funds accrual. £bn (real)
| Date | Universe assets | Buy-out liability | Base projection assets |
|---|---|---|---|
| 31 March 2025 | 1,102 | 1,073 | - |
| 31 March 2026 | 1,077 | 1,034 | 4 |
| 31 March 2027 | 1,053 | 996 | 8 |
| 31 March 2028 | 1,033 | 964 | 12 |
| 31 March 2029 | 1,019 | 934 | 16 |
| 31 March 2030 | 1,007 | 910 | 20 |
| 31 March 2031 | 988 | 881 | 24 |
| 31 March 2032 | 970 | 854 | 28 |
| 31 March 2033 | 953 | 829 | 32 |
| 31 March 2034 | 937 | 805 | 37 |
| 31 March 2035 | 922 | 782 | 41 |
Figure 2: Projected annual buy ins £bn (real)
| Year (March to March) | Run 5 | Run 3 | Run 4 |
|---|---|---|---|
| 2025 to 2026 | 44 | 48 | 53 |
| 2026 to 2027 | 43 | 45 | 51 |
| 2027 to 2028 | 35 | 42 | 49 |
| 2028 to 2029 | 19 | 40 | 49 |
| 2029 to 2030 | 13 | 33 | 42 |
| 2030 to 2031 | 10 | 29 | 40 |
| 2031 to 2032 | 7 | 12 | 36 |
| 2032 to 2033 | 3 | 12 | 38 |
| 2033 to 2034 | 6 | 19 | 30 |
| 2034 to 2035 | 2 | 3 | 32 |
Figure 3: Projected universe assets and buy out liabilities with no exits and no surplus extraction £bn (real)
|
Date |
TPR universe Assets | Transferred to insurance regime | Distributed as lump sum | Used to fund accrual |
|---|---|---|---|---|
| 31 March 2025 | 1,101 | - | 2 | - |
| 31 March 2026 | 1,056 | 17 | 4 | 4 |
| 31 March 2027 | 1,008 | 36 | 9 | 8 |
| 31 March 2028 | 958 | 50 | 25 | 12 |
| 31 March 2029 | 902 | 77 | 40 | 16 |
| 31 March 2030 | 846 | 106 | 55 | 20 |
| 31 March 2031 | 792 | 133 | 62 | 24 |
| 31 March 2032 | 733 | 168 | 69 | 28 |
| 31 March 2033 | 687 | 188 | 78 | 32 |
| 31 March 2034 | 638 | 211 | 88 | 37 |
| 31 March 2035 | 616 | 213 | 94 | 41 |