Evolution of occupational defined benefit schemes 2025
A 10-year forward look using the new TPR defined benefit (DB) universe projection model.
Key highlights
The DB landscape has undergone a paradigm shift over a short period of time such that the majority of schemes now have material surpluses. The introduction of the Pensions Schemes Bill will provide more options and opportunities in the future, in particular enabling access to these surpluses, so they are no longer 'trapped' and offering alternative consolidation vehicles. This means that trustees have a range of options available. They now need to make decisions about the future of their scheme, including:
- whether and at what point to exit the DB landscape through the traditional buyout (insurance market) route
- how and when to utilise the surplus that exists, either through running-on or at the point of buy-out
- whether to consolidate through the new superfund regime
Our analysis shows the following:
- The insurance market is able to absorb all schemes that may wish to buy out over the next decade, although there may be some short-term pressures. Over half of all schemes are expected to buy out. However, actual volumes in monetary amounts are uncertain, particularly with regards to the latter half of the decade.
- There is space in the market for both insurers and superfunds to operate.
- Over the following decade, the buy-out surplus is expected to increase to around £120 billion (real), which will need to be shared between savers and employers. It will be for trustees and employers to decide the form and timing of how they access this surplus.
- For schemes open to new entrants, ongoing funding surplus can be used to meet £30 billion of the cost of accrual over the following decade.
Now is the time for trustees to understand all the options and plan to determine the future of their schemes over the following decade. Doing so will ensure that pension schemes are well run, provide savers with the benefits they are expecting, and enable both savers and sponsors to use the material buy-out surplus that now exists.
TPR puts evidence at the heart of its decision-making as it seeks to protect, enhance and innovate in savers' interests. We will increasingly publish our insights to help inform better practices in the market and enable further debate.This report sets out the conclusions from the detailed modelling we have undertaken to investigate how the occupational DB pension scheme universe may evolve over the next ten years.
To model ten years into the future requires some broad assumptions, as how trustees and employers will react to the opportunities and incentives being introduced in the pensions bill is uncertain. Furthermore, these legislative changes are being made against the backdrop of a paradigm shift in DB scheme funding, such that the majority of schemes now have a material surplus on a low dependency and even buy-out basis. Trustees and sponsors are currently considering the options of buying out or running on, the potential value that could be obtained from these surpluses, and the financially optimal strategy that maximises the net present value of these surpluses. There are many factors that will impact this decision, including, amongst other things, the size of the scheme and its percentage of corporate capitalisation and profit.
Given this, we have deliberately used high-level assumptions around which we have undertaken sensitivities. For example, we have started with an assumption that 50% of larger schemes actively decide to generate and extract that surplus on an ongoing basis at the earliest opportunity available. We have also made an overriding assumption that every trustee board will take the opportunity to change their rules in order to avoid the previous problems associated with ’trapped surplus’.
We are not looking to provide a most likely estimate in this initial but rather to show a range of outcomes based on plausible underlying assumptions, which we hope will stimulate debate. We will revisit these scenarios annually to identify emerging trends and changing views. Therefore, the forecasts are likely to evolve and become more accurate as trustee and employer behaviour becomes more evident as legislation develops.
While this publication focuses on the evolution of the occupational DB pension scheme landscape, we are also undertaking modelling of the occupational defined contribution (DC) pension scheme landscape. The introduction in 2012 of automatic enrolment, requiring employers and employees to save into a pension scheme, has significantly increased pension participation, with 11 million more people saving into occupational DC pension schemes, primarily master trusts, over the last decade.
We intend to publish this DC analysis alongside our DB modelling in the future. Including DC will provide a broader and more complete picture, helping to further contextualise the overall shift in the pensions landscape.
Background
Note referring to ‘schemes’, where a scheme is sectionalised or segregated, we have treated each section as if it were a separate scheme for the purposes of this report. We have not aggregated the segregated sections to the parent level.
The funding positions of DB schemes have changed materially over the past few years, such that schemes are better funded than at any point in recent history, with the majority of schemes in surplus on a low dependency and buy-out basis. At the same time, the trend in the closure of DB schemes to new entrants and future accrual has continued, which means that the majority of DB schemes are gradually maturing towards the point where all savers are either close to retirement or have retired and are drawing their pension.
We have seen a growing and burgeoning bulk purchase annuity (BPA) market. There were around 300 transactions last year resulting in the transfer of around £50 billion of assets from occupational DB pension schemes to insurers. In parallel, we have also observed the establishment and operation of the first superfund as an alternative vehicle for DB consolidation and a greater number of, often larger DB schemes, considering ‘running on’ in the immediate future.
The starting point of our projections is 31 March 2025. At this time there were around 4,700 private sector occupational DB schemes holding £1.1 trillion of assets and promising pensions to around 9 million savers.
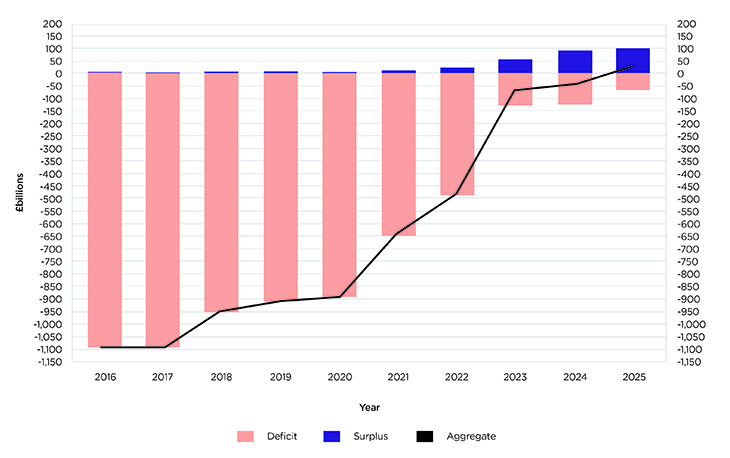
On a buy-out basis, the number of schemes in surplus has increased from 2% to 52% of the DB scheme population over the period 31 March 2016 to 31 March 2025 , with the surplus for these schemes increasing from around £2 billion to £92 billion.
Figure 1: historical funding position on a buyout basis as at 31 March – 2016 to 2025
Our approach to determining plausible scenarios to model
Our work looks at a range of scenarios to understand how the future evolution of funding positions, and behaviour of trustees and employers in managing long-term strategies, affects the DB sector.
We consider the scenarios modelled to be plausible based on discussions held with industry stakeholders. They are intended to prompt further debate and imply nothing about how TPR considers future government policy should develop. We stand ready to support the successful implementation of any future government policy.
We engaged with actuarial consultancies and other important stakeholders when determining a range of plausible scenarios. Read the Industry views section of our DB universal projections report for more information about the discussions.
The accompanying report provides greater detail regarding the underlying assumptions and approach that we have adopted in this regard. Note that long-term strategies are likely to be correlated with investment returns and that our model currently has one deterministic financial scenario and cannot draw out the implications of that. We have also made an over-riding assumption that every trustee board will take the opportunity to change their rules in order to use the surplus.
Below, we highlight the main observations from the potential progression of the DB universe over the 10 years to 31 March 2035:
1. Over 75% of schemes can potentially buy out over the next decade
Overall, absent any scheme exits from the current DB universe, we expect the size of assets under management (AUM) in the occupational DB pension scheme universe to increase over the 10-year period in nominal terms. However, after adjusting for expected inflation over the period, this leads to a reduction in real terms of around 10% from £1.1 trillion to around £1.0 trillion. The reduction in size of AUM is through the ongoing payment of pensions and lump sum cash payments to savers.
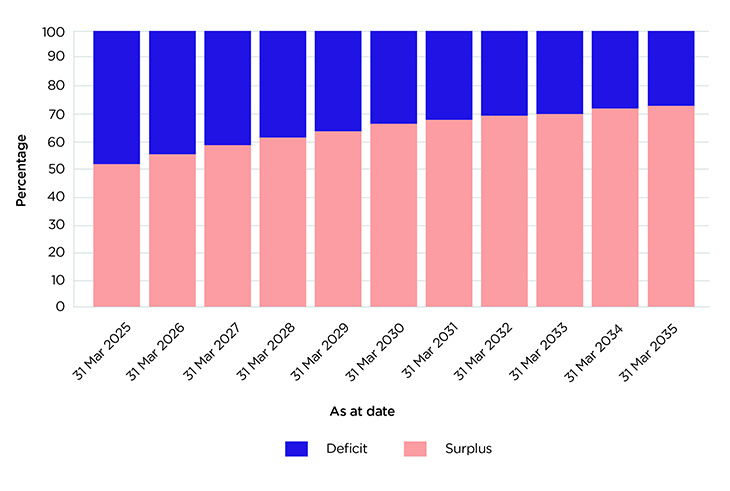
Simultaneously, we expect that the number of schemes being able to buy out without recourse to requiring additional employer contributions to increase from 52% of DB schemes at 31 March 2025 to around 75% of DB schemes by the end of the decade, equivalent to over 3,400 DB schemes. The breadth of schemes in a strong position is therefore expected to increase accordingly.
Figure 2: projected percentage of schemes in surplus and deficit on buy-out basis assuming no exits
2. DB schemes are likely to remain a material segment of the occupational pension scheme market
Given the anticipated level of demand for schemes to buy-out over the following decade, one of the key outcomes is that there will be a significant reduction in the number of occupational DB pension schemes, with our modelling estimating that around half of schemes transfer to the insurance sector and the other half remain in the occupational pension scheme sector.
The vast majority of the schemes expected to transfer to the insurance sector are ‘small’ schemes, which we have defined as those with AUM under £100 million. There is likely to continue to be a financially significant DB sector, with AUM in 2035 estimated to be around £0.6 trillion to £0.7 trillion (in real terms).
For context, the AUM of all occupational trust-based DC schemes, including those of master-trusts, has increased from £71 billion to £205 billion over the past five years (according to TPRs report Occupational defined contribution landscape in the UK 2024) and is expected to continue to grow over the next 10 years.
3. Over 2,000 schemes and more than £200 billion of assets could transfer to the insurance sector
There are now more options for DB schemes when considering how to secure their future. For some, buy-out remains the preference. The insurance market is able to meet current demand, and new competitors in the market mean that capacity is growing. We expect schemes that wish to buy out, and can afford to, will be able to do so over the projection period.
Based on our assumptions about the number and size of schemes who want to and are sufficiently funded to undertake a BPA transaction, combined with annual insurer capacity limits of around 350 schemes and around £50 billion (real) of liabilities, our projections show around 2,400 to 2,600 schemes with around £200 billion to £400 billion of assets are expected to participate in insurance transactions over the 10-year period.
Figure 3: cumulative volume of insurance transactions
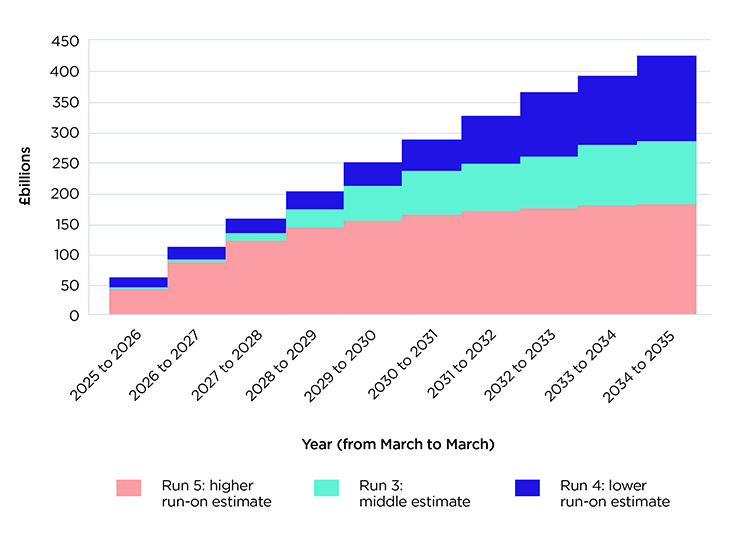
Read the text alternative of figure 3: cumulative volume of insurance transactions
As at 31 March 2025, there were around 3,650 small schemes (equivalent to 77% of schemes by number). The vast majority of the BPA transactions under all our scenarios are undertaken by these small schemes .
The majority of transactions are undertaken over the first half of the decade, where we have modelled that the insurance sector would absorb around 300 small schemes every year, equivalent to around 1,500 small scheme BPA transactions over the next five years and around 2,100 over the 10-year period.
The reduction in the number of transactions over the latter half of the decade is due to there not being enough schemes who wish to buy out having sufficient assets to be able to proceed with a transaction based on insurer pricing as at 31 March 2025. For many of the remaining schemes, it is possible that additional funding from the employer would enable the transfer to an insurer, although this is not something that we have incorporated into our modelling.
While the majority of schemes are ‘small’, the combined AUM for all small schemes accounted for only around 7% of the whole universe as at 31 March 2025. The overall level of transactions in pound amounts, particularly over the latter part of the decade, is highly dependent on the behaviour of ‘large’ schemes with AUM in excess of £250 million and, in particular, those schemes with AUM in excess of £1 billion.
We can see this in the large variation of projected transactions in the billions of pounds (real). Our estimates range from around £200 billion to around £400 billion in real terms of BPA transactions in respect of our lower and higher scenarios modelled. Whether large schemes decide to run-on or transfer to an insurer will determine how the market evolves over the latter part of the decade.
Based on industry feedback, our modelling has incorporated an increase in the time that it takes the initial BPA transaction to convert to a full buy-out. We have used a time period of three years in our modelling for all scenarios and have assumed that this remains constant over the 10-year period.
There was much debate over whether the recent increase in time required for insurers to fully onboard the scheme was just a temporary phenomenon or whether the continued demand for future transactions might actually increase this further. At the same time, we are aware of innovation in this area which may help to close this gap. We will keep this issue under observation.
4. Potential surplus opportunities for DB Schemes
Our modelling indicates that buy-out surpluses could exceed £120 billion (real) over the next decade, regardless of whether schemes choose to run on or buy out.
The actual amount of these surplus assets that are distributed over the 10-year period will depend on the actions and behaviours of individual schemes. The factors that affect the timing of accessing this surplus will depend, among others, on the following:
- whether to access surplus annually on an ongoing basis or wait to take as a single lump sum at the point of buy-out
- the size of any buffer to retain in the scheme to allow for adverse experience
- how to share any surplus release between savers and employers
To the extent that trustees and employers do not access their surplus within our projection period or access lower levels, the surplus will be retained within the scheme. In such situations, this surplus will still need to be accessed at some point, but this will go beyond our 10-year projection period.
Our modelling sets out various scenarios of how the £120 billion (real) could be accessed in full over the following decade, and the timing of that surplus distribution, which depends primarily on whether schemes run on or buy out. Our sensitivity analysis then shows the impact of delaying access to this surplus within the next decade, and instead the impact of retaining this in the scheme to access at a point in the future. For schemes that buy out over the next decade, they will have to use any surplus at that point.
Please note that we have not undertaken any analysis about what approach is most financially beneficial for maximizing the surplus value. This will depend on factors including the timing and size of when surplus is taken, ongoing scheme costs and discount rates to determine net present value. Trustees and employers should discuss such issues with their advisers.
Our discussions with industry suggest that around half of large schemes are considering running on in the short to medium term to access the surplus on an ongoing basis. As such, we have undertaken three scenarios, in which 25%, 50% or 75% of large schemes actively decide to run on and access the surplus, and the remaining schemes seek to buy out when possible. Under these three scenarios, the surplus refunded at point of buy-out is £80 billion (real), £52 billion (real) and £26 billion (real), with the resulting surplus that is distributed from running on being £40 billion (real), £64 billion (real) and £90 billion (real) respectively. Under the middle estimate (50% of large schemes run on), the timing of the £120 billion (real) surplus distribution is set out as follows:
Figure 4: annual surplus distribution combined £ billions (real)
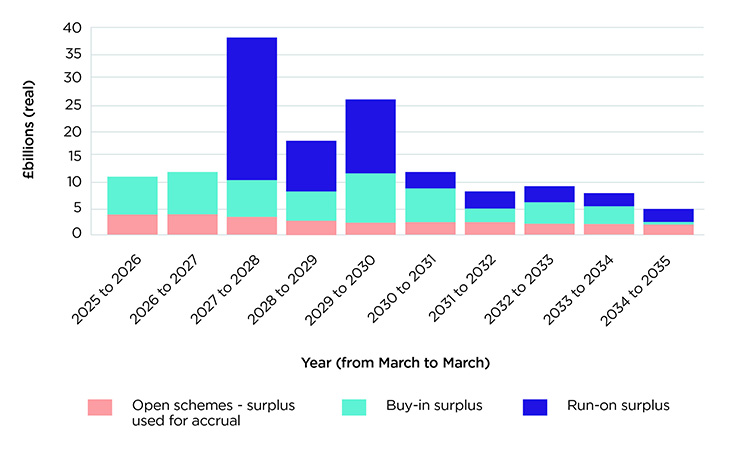
Read the text alternative of figure 4: annual surplus distribution combined £ billions (real)
Our sensitivity analysis shows the impact of schemes delaying access to surplus distribution through run-on over the next decade. Under the above middle estimate, surplus distribution falls to between £10 billion (real) and £32 billion (real), on the assumption that only 15% or 50% of schemes that run on actively distribute surplus. In these sensitivities, the surplus retained with-in schemes at the end of the decade increases by £58 billion (real) and £34 billion (real) respectively.
For schemes actively considering running-on and accessing surplus, industry feedback indicates a range of views regarding the funding level at which surplus will be extracted, but overall, trustees are generally expected to take a cautious approach to surplus extraction under a run-on model. Industry feedback also highlighted uncertainty about how surplus assets may be shared, which will be dependent on many factors, most of which will be scheme specific.
Our approach to the modelling assumes that, for schemes running on, the trustees retain a buffer before releasing any surplus at a level of 5% above the cost of buyout. This could be considered at the more conservative end of the range. We also assume any surplus distribution is shared 50% between savers (via a benefit enhancement) and employers, as this was considered the most neutral approach for modelling purposes. Our sensitivity analysis also considers the impact on alternative buffers and different distribution patterns between savers and employers.
Please note that none of our modelled scenarios or sensitivities should be interpreted as being considered maximum or minimum levels of surplus distribution. The projections show the impact on the DB universe over the following decade under these various alternative approaches.
For schemes that are open to new entrants, we have assumed that surplus is used to fund future accrual. We have assumed that open schemes use all surplus in excess of full funding on their technical provisions basis without any buffer, and our modelling indicates that £30 billion (real) of surplus can be used to fund future accrual.
In reality, there will be many factors that trustees and employers will need to consider when determining the funding basis, the level of any buffer to retain, and the timing for how any surplus is shared and distributed. We expect trustees and employers to engage with their advisers to assess the financial impact of run-on versus buy-out in order to develop a surplus distribution strategy aligned with scheme objectives.
5. A meaningful superfund market can exist alongside the BPA market
The Pension Schemes Bill has introduced a timescale for the introduction of legislation for superfunds. One commercial superfund is already operating, and we are aware of interest from other potential interested parties to enter the market.
At the moment, it is still too early to make any detailed predictions for how the superfund market may develop. As such, to understand how a meaningful superfund market might impact the DB sector over the next decade, we have derived a scenario in which the superfund market is considered to be an attractive and realistic alternative to the BPA market as a long-term solution for some schemes.
For the purposes of our modelling, this scenario assumes that 33% of schemes that are under £1 billion in size, and a small number of schemes over £1 billion in size with weak covenants for whom a superfund transaction could improve saver security, that may be looking to buy out at some time in the future, instead transfer to a superfund. We have restricted this option to only those schemes that meet the onboarding conditions, which we have simplified to be those schemes who can not afford the cost of buy out at the date of the superfund transaction.
This scenario shows transactions of around 350 schemes, with AUM transferring into the superfund market of around £35 billion (real).
Our analysis also indicates that the development of such a superfund market does not affect the BPA market over the short term, given that there are excess numbers of schemes who are sufficiently funded and want to insure all benefits. Over the 10-year period, the competition for consolidation in the DB market is expected to reduce the level of BPA transactions by around £10 billion (real). It should be noted that we have not included any allowance for a superfund ‘bridge to buy-out’ model within our analysis, which would increase the number and size of the BPA market in those scenarios.
6. Gilt holdings reduce across the sector
Our analysis suggests the level of gilt holdings that underpin the DB liabilities of the 4,700 initial schemes reduces by around 35% to 45% from around £570 billion to between £320 billion (real) and £380 billion (real), dependent on our higher and lower run-on scenarios.
Figure 5: volume of gilt holdings £ billions (real) - DB schemes and insurers combined
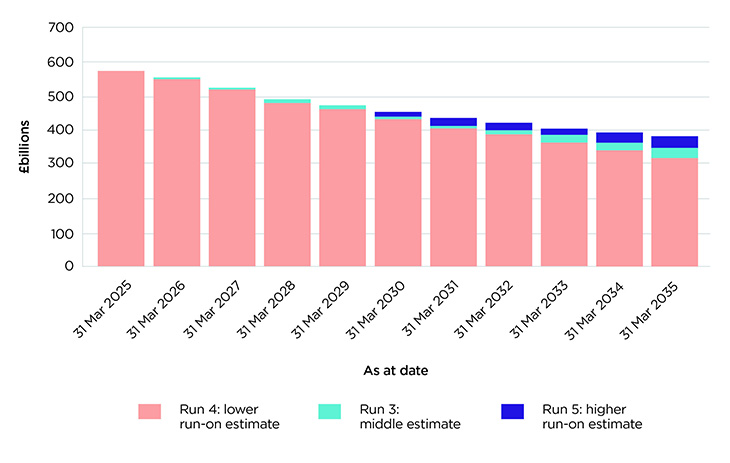
The reduction in gilt holdings is a consequence of schemes selling assets to pay savers’ pensions and provide surplus distribution, and for those schemes who buy-out, our assumption regarding how insurers invest the assets that are transferred. In particular, schemes currently have around 50% of their asset holdings in gilts, while we assume that insurance companies only hold 20% of their assets in gilts in respect of our proposed transactions.
Our expectation is that the overall gilt allocation for the occupational DB sector is unlikely to change materially. Therefore, the extent to which the above reduction applies will depend primarily on the investment appetite of the insurance sector for those schemes that transfer.
Our analysis also indicates that the average ‘duration’ of gilts held by DB pension schemes is expected to reduce over time, caused primarily due to schemes maturing and the average duration for pension scheme liabilities reducing.
Summary of results
If the projections below occur in practice, we can expect substantial activity across the DB and insurance markets within a relatively short time. We will continue to monitor how the market evolves to ensure it continues to meet savers’ needs.
For the purpose of this report, ‘small schemes’ means schemes with assets less than £100 million as at 31 March 2025 and ‘large schemes’ means schemes with assets more than £250 million as at 31 March 2025.
Summary of scenarios modelled
Run 1: base projection
The base projection assuming all schemes run-on with no scheme exits and no surplus extraction.
Run 2: technical provisions surplus used to fund accruals
Technical provision surplus is used to fund accruals for open and open to accrual schemes, and no further schemes exit or permit surplus extraction.
Run 3: run-on scenario 1 (50% run on)
50% of large schemes (greater than £250 million) run on for 10 years, surplus extraction is 50% benefit uplift and 50% paid out immediately as lump sum whilst none of the small schemes (less than £100 million) run on except those that are open or immature and open to accrual.
Run 4: run on scenario 2 (25% run on)
25% of large schemes (greater than £250 million) run on for 10 years, surplus extraction is 50% benefit uplift and 50% paid out immediately as lump sum while none of the small schemes (less than £100 million) run on except those that are open or immature and open to accrual.
Run 5: run on scenario 3 (75% run on)
75% of large schemes (greater than £250 million) run on for 10 years, surplus extraction is 50% benefit uplift and 50% paid out immediately as lump sum whilst none of the small schemes (less than £100m) run on expect those that are open or immature and open to accrual
Run 6: superfund scenario
From 2026, around 350 schemes conduct a superfund transaction. These are broadly 33% of schemes that we assume are not running on and are less than £1 billion in size with buyout funding level between 80% to100% plus a small number of £1 billion plus schemes.
Table 1a - Projected TPR DB universe at 31 March 2035
|
31 March 2025 |
Run 1 |
Run 2 |
Run 3 |
Run 4 |
Run 5 |
Run 6 |
|
|---|---|---|---|---|---|---|---|
|
Number of schemes |
4,702 |
4,702 |
4,702 |
2,288 |
2,233 |
2,369 |
2,346 |
|
Assets (£ billion real) |
1,102 |
963 |
922 |
616 |
564 |
674 |
622 |
|
Technical provisions (£ billions real) |
935 |
698 |
698 |
548 |
504 |
598 |
553 |
|
Low dependency (£ billions real) |
999 |
739 |
739 |
587 |
542 |
639 |
593 |
|
Buy-out liabilities (£ billions real) |
1,073 |
782 |
782 |
623 |
577 |
677 |
628 |
Table 1b - Projected number of transactions 31 March 2025 - 31 March 2035
|
31 March 2025 |
Run 1 |
Run 2 |
Run 3 |
Run 4 |
Run 5 |
Run 6 |
|
|---|---|---|---|---|---|---|---|
|
Number of buy-ins |
N/A |
N/A |
N/A |
2,498 |
2,607 |
2,401 |
2,338 |
|
Number of buy-outs (exits from TPR Universe) |
N/A |
N/A |
N/A |
(2,414) |
(2,469) |
(2,333) |
(2,356) |
|
Number of superfund transactions |
N/A |
N/A |
N/A |
- |
- |
- |
326 |
Table 1c - Projected transactions with-in TPR universe
|
|
31 March 2025 |
Run 1 |
Run 2 |
Run 3 |
Run 4 |
Run 5 |
Run 6 |
|---|---|---|---|---|---|---|---|
|
Size of buy-ins (£ billions real) |
N/A |
N/A |
N/A |
256 |
379 |
167 |
244 |
|
Buy-ins - Surplus used for benefit increases (£ billions real) |
N/A |
N/A |
N/A |
26 |
40 |
13 |
26 |
|
Run-on - Surplus used for benefit increases (£ billions real) |
N/A |
N/A |
N/A |
32 |
20 |
45 |
32 |
|
Surplus used to fund accrual (£ billions real) |
N/A |
N/A |
33 |
30 |
30 |
30 |
30 |
|
Superfund (£ billions real) |
N/A |
N/A |
N/A |
N/A |
N/A |
N/A |
35 |
Table 1d - Projected exits with-in TPR universe
|
|
31 March 2025 |
Run 1 |
Run 2 |
Run 3 |
Run 4 |
Run 5 |
Run 6 |
|---|---|---|---|---|---|---|---|
|
Run-on - Surplus paid out as lump sum (£ billions real) |
N/A |
N/A |
N/A |
(32) |
(20) |
(45) |
(32) |
|
Buy-ins - Surplus paid out as lump sum (£ billions real) |
N/A |
N/A |
N/A |
(26) |
(40) |
(13) |
(26) |
|
Buy-outs (£ billion real) |
N/A |
N/A |
N/A |
(250) |
(309) |
(184) |
(245) |
Read the full report for further details about the modelling.
Appendix: data supporting the charts in this report
Data for figure 1: historical funding position on a buyout basis as at 31 March – 2016 to 2025
| Year | 2016 | 2017 | 2018 | 2019 | 2020 | 2021 | 2022 | 2023 | 2024 | 2025 | |
|---|---|---|---|---|---|---|---|---|---|---|---|
| Surplus | Surplus - Buy-out | 1.5 | 1.5 | 3.1 | 3.8 | 2.6 | 4.7 | 9.6 | 61.6 | 80.8 | 92.1 |
| Deficit | (Deficit) - Buy-out | -1,089.5 | -1,089.5 | -949.9 | -905.1 | -891.3 | -645.0 | -484.4 | -128.4 | -120.7 | -63.2 |
| Aggregate | (Deficit)/Surplus £ billion | -1,088 | -1,088 | -947 | -901 | -889 | -640 | -474 | -67 | -40 | 29 |
Data for figure 2: projected percentage of schemes in surplus and deficit on buy-out basis assuming no exits
| As at date | Surplus | Deficit |
|---|---|---|
| Monday, March 31, 2025 | 52% | 48% |
| Tuesday, March 31, 2026 | 56% | 44% |
| Wednesday, March 31, 2027 | 59% | 41% |
| Friday, March 31, 2028 | 61% | 39% |
| Saturday, March 31, 2029 | 64% | 36% |
| Sunday, March 31, 2030 | 66% | 34% |
| Monday, March 31, 2031 | 68% | 32% |
| Wednesday, March 31, 2032 | 69% | 31% |
| Thursday, March 31, 2033 | 70% | 30% |
| Friday, March 31, 2034 | 72% | 28% |
| Saturday, March 31, 2035 | 73% | 27% |
Data for figure 3: cumulative volume of insurance transactions £ billions (real)
| Year (March to March) | Run 5: higher run-on estimate | Run 3: middle Estimate | Run 4: lower run-on estimate |
|---|---|---|---|
| 2025 to 2026 | 44 | 48 | 53 |
| 2026 to 2027 | 87 | 93 | 104 |
| 2027 to 2028 | 121 | 135 | 152 |
| 2028 to 2029 | 141 | 175 | 201 |
| 2029 to 2030 | 153 | 208 | 244 |
| 2030 to 2031 | 163 | 237 | 283 |
| 2031 to 2032 | 170 | 248 | 319 |
| 2032 to 2033 | 173 | 260 | 358 |
| 2033 to 2034 | 179 | 279 | 388 |
| 2034 to 2035 | 180 | 283 | 419 |
Data for figure 4: annual surplus distribution combined £ billions (real)
| Year | Run-on surplus | Buy-in surplus | Open schemes - surplus used for accrual |
|---|---|---|---|
| 2025 to 2026 | - | 6 | 4 |
| 2026 to 2027 | - | 8 | 4 |
| 2027 to 2028 | 27 | 7 | 4 |
| 2028 to 2029 | 9 | 6 | 3 |
| 2029 to 2030 | 14 | 9 | 2 |
| 2030 to 2031 | 3 | 6 | 3 |
| 2031 to 2032 | 3 | 3 | 3 |
| 2032 to 2033 | 3 | 4 | 3 |
| 2033 to 2034 | 2 | 3 | 2 |
| 2034 to 2035 | 2 | 0 | 2 |
Data for figure 5: volume of gilt holdings £ billions (real) - DB schemes and insurers combined
| Run 3 | Run 4 | Run 5 |
|---|---|---|
| 573 | 573 | 573 |
| 552 | 549 | 547 |
| 521 | 522 | 524 |
| 490 | 491 | 492 |
| 462 | 463 | 471 |
| 443 | 437 | 453 |
| 419 | 409 | 436 |
| 402 | 390 | 421 |
| 386 | 367 | 407 |
| 366 | 347 | 394 |
| 354 | 323 | 381 |