Occupational defined contribution landscape in the UK 2025
Published: 17 March 2026
Introduction
This is an official statistics publication produced by The Pensions Regulator (TPR). This annual publication provides an overview of the occupational defined contribution (DC) landscape in the UK, reporting on schemes, memberships and assets. Additional data tables to support user analysis can be found in the annexes.
While this publication focuses on DC schemes, Table 1 below shows occupational trust-based pensions provision across all scheme types in the UK. We include this overview table to provide context on the broader pensions landscape. Within table 1 the DB statistics include DB members in pure DB and hybrid schemes.
| DC (trust) | Hybrid: dual-section | DB (Public Service) | DB (Private Sector) | |
|---|---|---|---|---|
| Schemes | 24,720 | 430 | 200 | 5,060 |
| Total membership | 31,113,000 | 3,727,000 | 19,784,000 | 9,174,000 |
| Total active memberships | 10,791,000 | 751,000 | 7,448,000 | 662,000 |
Within this publication statistics coverage varies. Some statistics include all occupational DC schemes, others include specific subsets by size, type or other characteristics. See the accompanying commentary and table notes for specific coverage.
Although there are 30 authorised master trusts, these master trusts have 48 sections in total. For this publication we treat each of the sections as separate schemes.
All figures are rounded according to their category: scheme counts to the nearest ten, membership figures to the nearest thousand and financial values to the nearest million. As a result, some percentages cited in the commentary may differ from calculations made using the rounded figures presented in charts or tables. This reflects that all percentages are derived from the unrounded data.
Important changes since last year
This year the DC landscape includes additional statistics in the main report. This includes breakdowns of hybrid assets and segmenting membership data into active and deferred membership. The tables in Annex 3 have been restructured to improve comprehension. Annex 6, which covered metadata (effective dates) has been removed. If you have any queries about these changes, please contact: evidenceandinsight@tpr.gov.uk.
Key findings
-
The DC landscape has been subject to further concentration.
-
The number of non micro DC and hybrid schemes decreased by 15% over the last year, from 920 schemes in 2024 to 790 schemes in 2025.
-
The reduction in schemes is concentrated in non micro schemes with fewer than 5,000 memberships, whilst the number of larger schemes remains stable.
-
The year-on-year reduction was 15% in both 2023–24 and 2024–25, representing the largest proportional decrease to date.
-
-
Membership in DC schemes (including hybrid schemes and excluding micro schemes) continues to increase, but this is driven by deferred members:
-
Total memberships increased by 7% between 2024 and 2025, from 30.6 million memberships in 2024 to 32.8 million memberships in 2025.
-
Deferred memberships represented 65% of total memberships in 2025.
-
With 30.1 million memberships, master trusts continue to provide for the majority (or 92%) of DC memberships.
-
-
DC scheme assets (excluding micro and hybrid schemes) continue to grow:
-
Assets have grown by 22%, from £205 billion in 2024 to £249 billion in 2025.
-
Master trusts hold £208 billion in assets (83% of DC schemes assets in total, excluding hybrid schemes).
-
A broader upwards trend in assets per membership continues, with a 13% increase from £7,000 in 2024 to £8,000 in 2025.
-
Growth in assets is driven by a combination of contributions and investment returns.
-
Schemes and membership
Schemes
-
There are 25,160 schemes in the landscape.
- 420 are non micro DC schemes, 370 are hybrid schemes and 24,370 are micro schemes.
-
In 2025, the DC landscape has been subject to further concentration.
-
The total number of DC schemes (excluding micros), has declined by 15%, from 920 schemes in 2024 to 790 schemes in 2025.
-
The reduction in schemes is driven by non micro schemes with fewer than 5,000 memberships.
-
-
For DC schemes (excluding hybrid and micro), 100 schemes are open (25%), 30.5 million memberships are in open schemes (98%), and £243 billion worth of assets are held in open schemes (97%).
-
Of the 24,300 non-hybrid micro schemes, 87% (21,260) identified themselves as a relevant small scheme (RSS).
-
3% (610) have been identified as an executive pension plan (EPP).
-
The proportion of RSS increased from 84% in 2024, whereas the proportion of EPPs stayed broadly at the same level in 2024.
-
Figure 1: Occupational DC schemes by membership size group (including hybrid schemes, excluding micro schemes) (2011 to 2025)
Figure 1 shows the trend in the number of occupational DC schemes by membership size from 2011 to 2025, including hybrid schemes and excluding micro schemes. The data corresponding to this figure is available in annex 1, table 1.13.
-
The total number of schemes reduced by 15% between 2024 and 2025 from 920 to 790.
-
This is consistent with the reduction between 2023 and 2024, with both years representing the largest proportional decrease to date.
-
Schemes with less than 5,000 memberships drove this reduction in 2025: decreasing 17% from 2024 levels, whilst schemes with 5000+ members remained stable at 120.
-
-
Between 2011 and 2025 the total number of schemes decreased by 78%, from 3,660 to 790.
- The greatest decline occurred in schemes with 12 to 99 memberships, from 2,260 in 2011 to 350 schemes in 2025, a decrease of 85%.
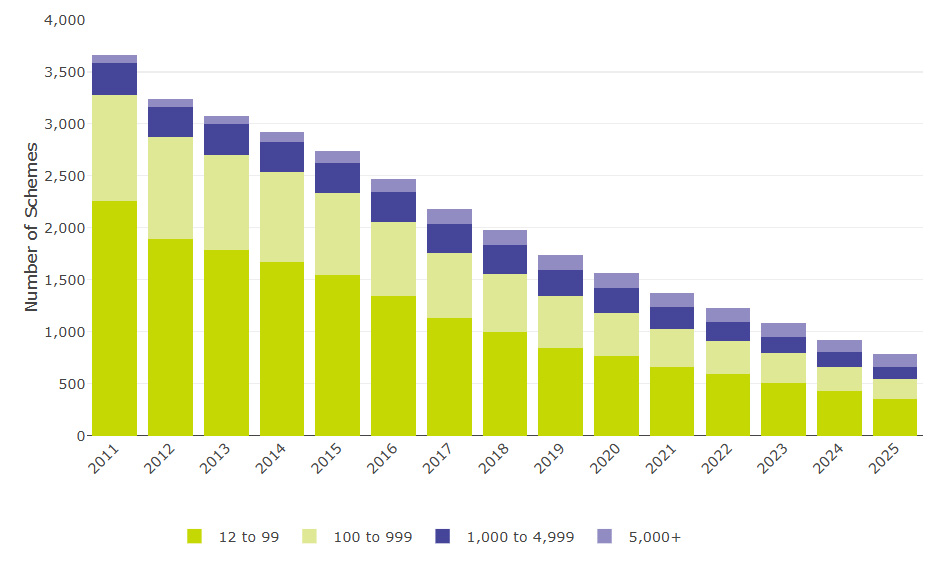
Table 2: Number of schemes, memberships and assets by status (excluding micro schemes) (2025)
Table 2 shows how many schemes, members and assets are in open closed or winding up status. Micro schemes are excluded.
-
For DC schemes (excluding hybrid), 100 schemes are open (25%), 30.5 million memberships are in open schemes (98%), and £243 billion worth of assets are held in open schemes (97%).
-
For hybrid schemes only, 160 schemes are open (42%). These open schemes account for 1.3 million memberships (74%), and hold assets worth £46 billion (71%).
- The number of open hybrid schemes has fallen from 180 in 2024, a decline of 11%. Over the same period, the value of assets held in open hybrid schemes increased by £4 billion (10%).
| Open to new joiners and future service | Closed to new joiners, open to future service | Closed to new joiners and future service | Winding Up | Total | |
|---|---|---|---|---|---|
| Number of DC schemes | 100 | 130 | 140 | 50 | 420 |
| Number of DC memberships | 30,494,000 | 182,000 | 39,000 | 329,000 | 31,044,000 |
| DC aggregated assets | £242,616.2m | £5,077.4m | £542.3m | £842.6m | £249,078.4m |
| Number of hybrid schemes | 160 | 110 | 90 | 10 | 370 |
| Number of hybrid memberships | 1,303,000 | 368,000 | 75,000 | 3,000 | 1,749,000 |
| Hybrid aggregated assets | £45,959.0m | £14,578.7m | £4,047.2m | £172.0m | £64,756.9m |
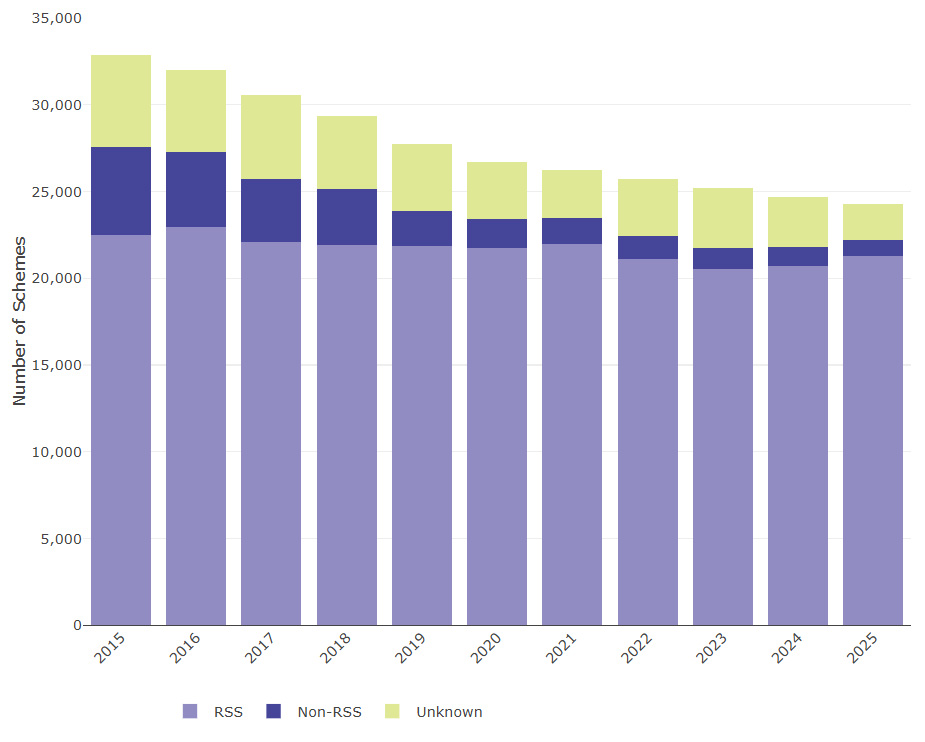
Figure 2: Micro schemes by relevant small scheme (RSS) status (excluding hybrid schemes) (2015 to 2025)
Micro schemes are subject to different regulatory requirements depending on whether they are classified as a RSS. Figure 2 shows the trend in the number of micro schemes, by RSS status from 2015 to 2025, excluding hybrid schemes. The data corresponding to this figure is available in annex 1, table 1.14.
-
The total number of micro schemes decreased by 26% from 32,890 in 2015 to 24,300 in 2025.
-
RSS remains the largest subset of micro schemes representing 87% (21,260 schemes) in 2025, and its share in the market has increased from 68% (in 2015).
- However, the actual number of schemes has remained broadly consistent since 2015 (22,500 schemes), with some small year-on-year variations.
-
Non-RSS schemes represent 4% (940 schemes) decreasing from 15% (5,050) schemes in 2015.
Memberships
The following figures in the membership section all relate to non micro schemes and hybrid schemes:
-
There are 32.8 million memberships in 2025 compared to 30.6 million in 2024, a 7% increase.
-
Scheme memberships are now nearly 15 times larger than the number of memberships in 2011, with 32.8 million memberships in 2025 compared to 2.3 million in 2011.
-
The number of active members increased from 11.1 million memberships in 2024 to 11.4 million memberships in 2025, a 3% increase. The number of deferred members increased from 19.5 million memberships in 2024 to 21.3 million memberships in 2025, a 9% increase.
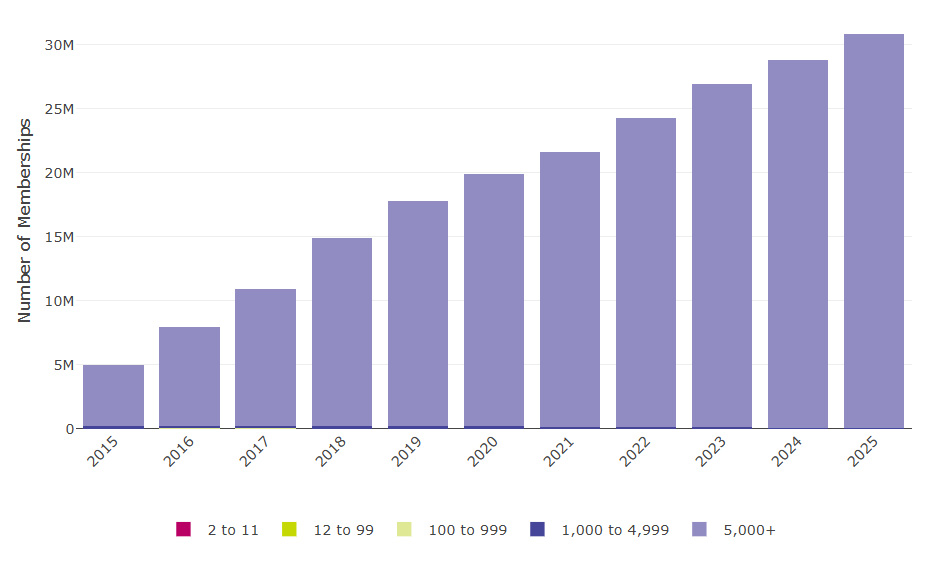
Figure 3: Memberships of occupational DC schemes by membership size group (including hybrid schemes, excluding micro schemes) (2011 to 2025)
Figure 3 shows the trend in the number of memberships of occupational DC schemes by membership size group from 2011 to 2025. Automatic enrolment (AE) was launched in a staggered approach from October 2012 until February 2018. The data corresponding to this figure is available in annex 2, table 2.1.
-
Between 2024 and 2025, total memberships increased by 7% from 30.6 to 32.8 million.
-
This year on year growth was driven mostly by schemes with over 5,000 memberships, which saw a 7% rise in memberships.
-
Smaller schemes with 12 to 4,999 memberships saw a 13% decrease between 2024 and 2025.
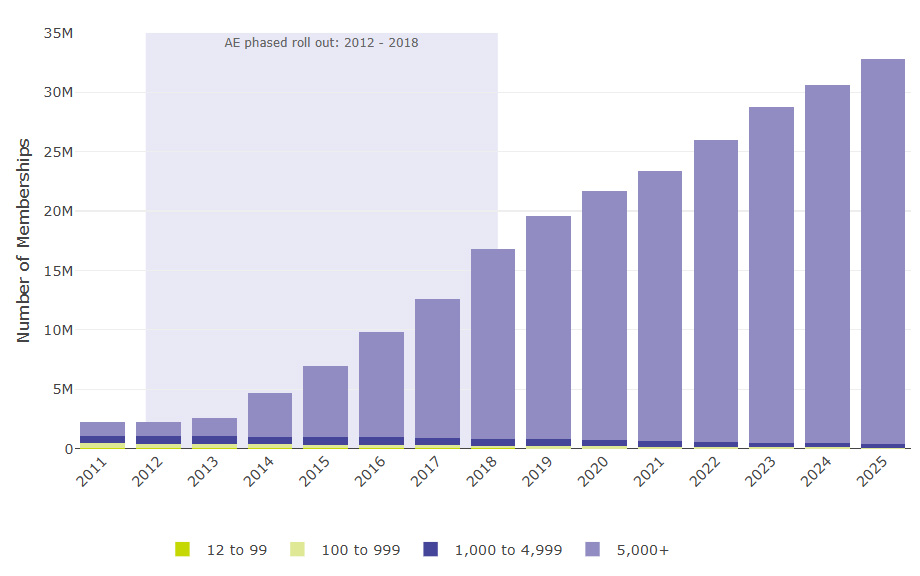
Figure 4: Active and deferred memberships of occupational DC schemes (including hybrid schemes, excluding micro schemes) (2011 to 2025)
Figure 4 shows the number of active and deferred memberships between 2011 and 2025. The data corresponding to this figure is available in annex 2, tables 2.2 and 2.3.
-
Although AE drove the initial growth in memberships by an average of 2.1 million a year between 2012 and 2018, memberships have continued to rise by an average of 2.3 million a year since 2019.
-
The total membership growth has been driven primarily by an increase in deferred members rather than active members.
-
Deferred members represent 65% (or 21.3 million) memberships in 2025, from the lowest levels of 34% (or 1.6 million) in 2014.
-
Deferred membership became predominant in 2020 (with 53% share of members).
-
Between 2024 and 2025, there has been a 9% increase in deferred members.
-
-
The growth rate for active members slowed in 2018 as the staged roll out of automatic enrolment completed.
-
Active members represent 35% (or 11.4 million) memberships in 2025, down from the highest share in 2014 (65%, although only 3.1 million members).
-
Year-on-year active membership growth slowed substantially since the end of AE staging, and since 2020 growth has averaged about 2% per year.
-
Between 2024 and 2025, there was a 3% increase in active members.
-
-
The number of pensioner members in 2025 is 0.1 million, and it is less than 0.5% of all non-micro members.
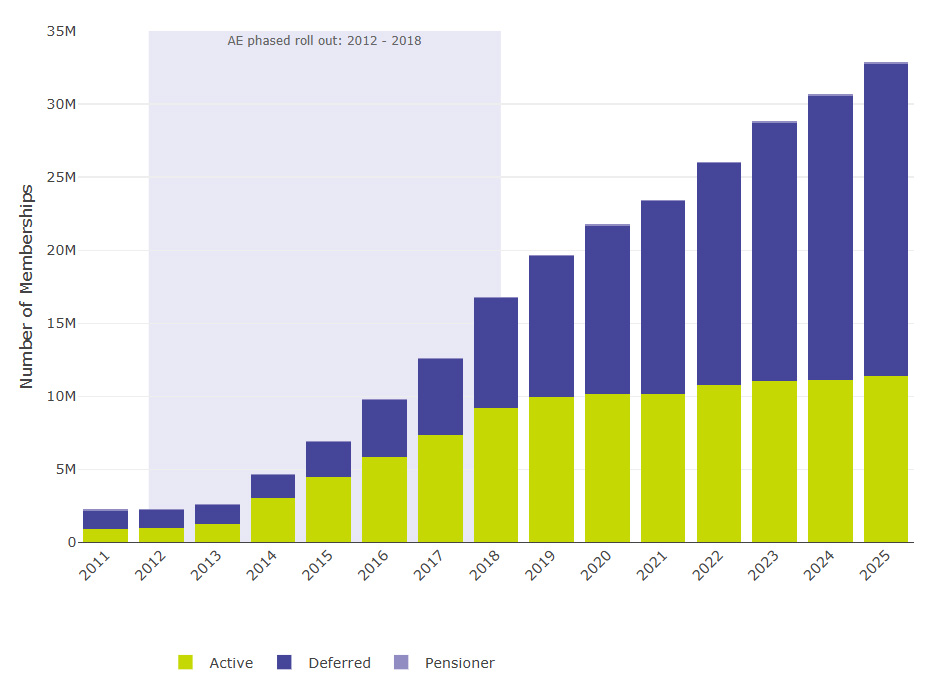
Note: Pensions members are included but they account for 0.1 million memberships (<0.5% of the total) and are therefore not visible at this scale.
Assets
This section summarises both assets held by DC schemes (excluding hybrid and micro) and DC assets within hybrid schemes.
-
Reported asset values in non hybrid non micro DC schemes are £249 billion in 2025.
-
This is an increase of £44 billion or 22% since last year, and are more than 10 times larger than in 2011 when assets were £22 billion.
-
In 2025, there has been a growth of 13% in assets per membership in DC schemes (excluding hybrid and micro) since 2024.
Table 3: Aggregate reported assets in occupational DC schemes by membership size group (£m) and scheme type (including hybrid schemes and micro schemes, excluding RSS and EPP schemes) (2025)
Table 3 shows assets by scheme type and size. £250 billion assets are in DC schemes, £66 billion assets are in hybrid schemes. 5,000+ membership DC schemes have £244 billion, (98%) of total DC assets.
| Scheme type | 2 to 11 | 12 to 99 | 100 to 999 | 1,000 to 4,999 | 5,000+ | Total |
|---|---|---|---|---|---|---|
| Defined Contribution | £1,016m | £214m | £1,124m | £3,244m | £244,497m | £250,094m |
| Hybrid | £867m | £268m | £4,002m | £12,185m | £48,302m | £65,624m |
| Total | £1,883m | £482m | £5,126m | £15,429m | £292,799m | £315,719m |
Figure 5: Aggregated reported assets in occupational DC schemes by membership size group (excluding hybrid schemes and micro schemes) (2011 to 2025)
Figure 5 shows the trend in the aggregate reported assets in occupational DC schemes (excluding hybrid schemes and micro schemes), by membership size group from 2011 to 2025. Between these years, total assets grew from approximately £22 billion to £249 billion, with the vast majority of assets held in scheme with 5000+ members. The data corresponding to this figure is available in annex 3, table 3.1.
- Assets have grown from £205 billion in 2024 to £249 billion in 2025, a 22% increase.
- This 2025 asset value is double the asset value of £114 billion in 2021.
- Examining the growth in assets over five-year periods, growth accelerated sharply between 2016 and 2020 (more than doubling, with an increase of £48 billion).
- Between 2021 and 2025 growth has stabilised but a similar rate – more than doubling again, with an increase of £136 billion.
- Most of the growth happened to schemes with over 5,000 memberships, with aggregate assets now 22 times larger than they were in 2011 (two times larger than in 2021).
- Assets in these schemes have risen from £11 billion in 2011 (through £105 billion in 2021) to £244 billion in 2025.
- Schemes with 12 to 4,999 memberships have seen an overall decrease in their reported assets, from £11 billion in 2011 (and from £8 billion in 2021) to £5 billion in 2025.
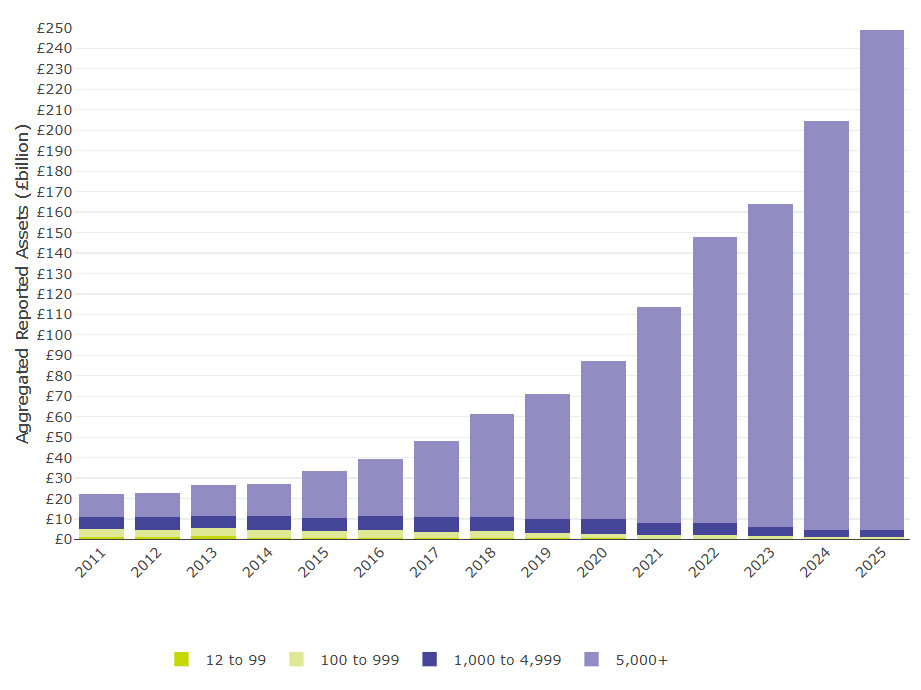
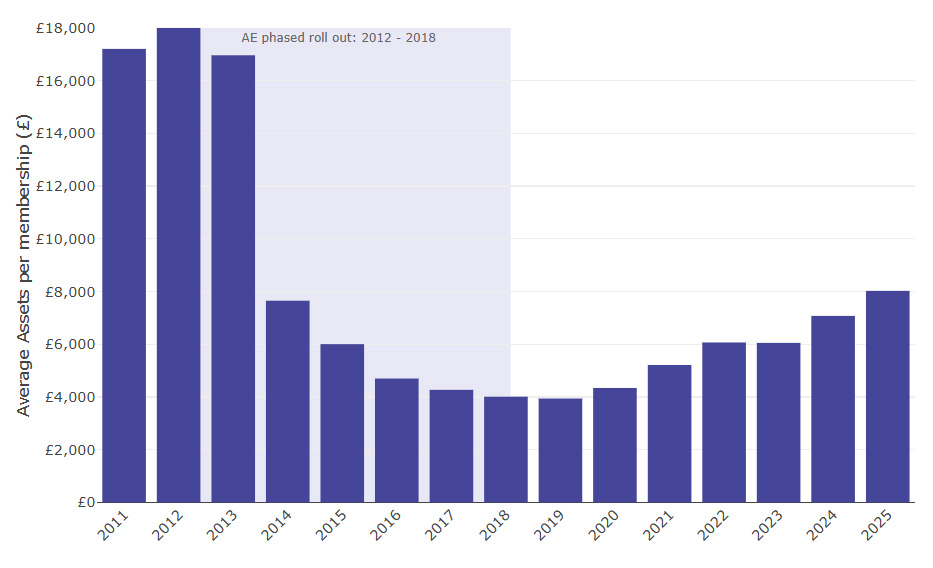
Figure 6: Average assets per membership in occupational DC schemes (excluding hybrid schemes and micro schemes) (2011 to 2025)
Figure 6 shows the trend in the average assets per membership in occupational DC schemes from 2011 to 2025, excluding hybrid schemes and micro schemes. The data corresponding to this figure is available in annex 3, table 3.10.
-
Average assets per member increased by £1,000 between 2024 and 2025 from £7,000 to £8,000.
- This continues a broader upwards trend, following a small decrease in assets per member in 2023, and reflects the longer term pattern of growth since 2019.
-
Average assets per member have doubled from £4,000 in 2019, but are still 55% below their highest point in 2012 of £18,000.
Master trusts
Master trusts constitute fewer than 0.5% of all DC and hybrid schemes, yet they account for the greatest market share.
Master trusts provide 92% of memberships in non micro DC schemes and hold 83% of DC assets.
In total, master trusts manage 30.1 million memberships and £208 billion in assets (excluding hybrids).
Table 4: Figures for all master trust schemes with DC memberships, including hybrid master trusts (2025)
| Authorised master trusts (including hybrids) | Authorised master trusts (excluding hybrids) | |
|---|---|---|
| Active DC memberships | 10,342,000 | 10,244,000 |
| Reported assets (£m) | 211,467 | 207,722 |
| DC memberships in schemes which reported assets | 30,090,000 | 29,869,000 |
| Total DC memberships | 30,095,000 | 29,869,000 |
Automatic enrolment
All figures below refer to micro and non micro schemes, excluding hybrid schemes.
-
The number of schemes used for AE has remained broadly the same, at 320 in 2025 (rounded to the nearest 10).
-
This represents a 22% reduction since the greatest levels in 2018 when there were 400 schemes.
-
In 2025, 99% of memberships are in schemes that have been used for AE: representing 30.9 million out of 31.1 million.
Figure 7: Occupational DC schemes which have been used for AE by membership size group (excluding hybrid schemes, including micro schemes) (2015 to 2025)
Figure 7 shows the trend in the number of occupational DC schemes used for AE, by membership size group from 2015 to 2025, excluding hybrid schemes and including micro schemes. The data corresponding to this figure is available in annex 4, table 4.11.
-
In 2015 the number of schemes used for AE was 240. This peaked 2018 at 400 schemes and had fallen to 320 schemes in 2025 (same as in 2024).
-
Micro schemes of 2–11 members make up the largest proportion of AE schemes in 2025, which reflects similar proportions in 2024, where micros had a 61% share.
-
Since 2015, the landscape has shifted: large schemes (100+ members) dominated at 92% of AE schemes, while micro schemes numbered only 10 AE schemes.
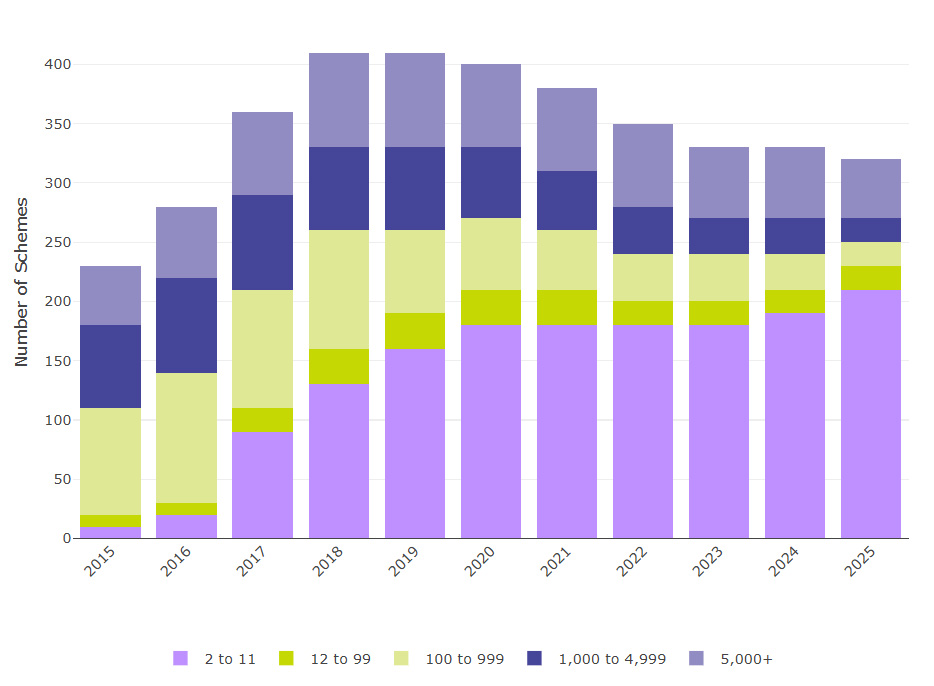
Figure 8: Memberships within occupational DC schemes which have been used for AE by membership size group (excluding hybrid schemes, including micro schemes) (2015 to 2025)
Figure 8 shows the trend in the number of memberships of occupational DC schemes which have been used for AE, by membership size group from 2015 to 2025, excluding hybrid schemes and including micro schemes. The data corresponding to this figure is available in annex 4, table 4.12.
-
The total number of memberships in DC schemes used for AE in 2025 accounted for 99% of all memberships in DC schemes – this has been consistent for the last 6 years.
-
The number of memberships in schemes used for AE grew by 7% from 29 million to 31 million between 2024 and 2025.
-
Nearly all memberships remain concentrated in schemes with 5,000+ members, with schemes below 5,000 representing less than 0.1% of memberships
Note: 2 to 999 membership size groups are included in figure 8. There are less than 48,000 memberships in these categories (<0.1% of the total).
Data sources
The data used to produce our official statistics is collected from all registerable occupational DC and hybrid schemes, through our DC and hybrid scheme returns. This report uses data held by us as of 31 December 2025. The DB scheme statistics in table 1 uses data held by us as of 31 March 2025.
-
DC schemes are required to submit their scheme returns between September and December 2025. Please note this includes one authorised collective defined contribution (CDC) scheme.
-
Non micro schemes submit annually and micro schemes submit every three years.
-
Hybrid schemes are required to submit their returns by 31 March annually.
The figures in this report relate to the scheme’s effective date, which for DC schemes falls between 1 September 2024 to 31 December 2025. For hybrid schemes it falls between 1 April 2024 and 31 March 2025.
Where a scheme is sectionalised or segregated, each section will be treated as if it were a separate scheme for this report. Master trusts are reported as both the number of schemes and the number of authorised master trusts those schemes fall into.
Please note that individuals may have multiple pension entitlements spread over multiple schemes, so they may be included more than once in ‘membership’ counts.
While the vast majority of relevant schemes have provided us with the market value of their scheme assets and annual contributions, it is not completed by every scheme. We limit reporting to those asset or contribution values whose effective date is no more than three years before 31st of December each year, or five years for micro scheme contributions.
Data on which schemes have been used for AE is sourced from employers’ declarations of compliance. This declaration is a legal duty for employers (or an entity working on their behalf) to submit every three years. All declarations or re-declarations of compliance up to 31 December 2025 have been used.
Methodology
These statistics are derived from administrative data, and accuracy is addressed by eliminating data errors as far as possible. Potential sources of error include the following:
-
Schemes entering data incorrectly as part of their scheme return
-
Data processing while creating structured datasets from the scheme return input and any manual corrections as part of that process
-
Mistakes in the programming code used to analyse the data and produce the statistics, and by analysts interpreting the data incorrectly
Throughout this publication, within data tables we have rounded scheme numbers to the nearest ten, memberships to the nearest thousand, financial figures to the nearest million, and percentage figures to 0 decimal places. For this reason, the sum of figures may not equate to the total values. Within the text of the publication we have rounded scheme numbers to the nearest 10, memberships to the nearest 0.1 million, financial figures to the nearest billion, and percentage figures to 0 decimal places.
Relavant small schemes and executive pension plans
Within this report, RSS and EPP schemes are always included in the data where micro schemes are included, unless stated otherwise.
RSS are identified via schemes declaring their RSS status in the scheme return.
Schemes may have an unknown RSS status if they have been registered for less than three years, if they have cancelled all previous scheme returns by request or if they have deleted their RSS flag.
EPP schemes are classified as schemes which have not identified as RSS via the scheme return but meet one of the following criteria:
-
they have declared to be an EPP via the DC scheme return
-
they have not declared their EPP via the scheme return but the name of the scheme indicates EPP status (for example, ‘company XYZ Executive Pension Plan’)
Scheme status data validation
There are three ordered validation steps applied to the status of DC schemes and DC sections of hybrid schemes.
-
Step 1: where a scheme states they are open but have no active DC memberships, no employer contributions and no employee contributions, the status is adjusted to ‘closed to future service’.
-
Step 2: where a scheme states they are closed to new members but have no active DC memberships, no employer contributions and no employee contributions, the status is adjusted to ‘closed to future service’.
-
Step 3: where a scheme states they are open but have had declining total membership over the previous three scheme returns, the status is adjusted to ‘closed to new members’.
In all other cases, statuses are taken to be as submitted by the scheme.
Contributions data is only considered as part of this validation if it meets all the following criteria:
-
the data has been submitted as part of this scheme return
-
the value of contributions has changed since the previous scheme return submission
-
the value of contributions is larger than £1
For schemes that are classified as closed to future service, any memberships that are classified as ‘active’ have been reclassified as ‘deferred’.
Reported hybrid scheme assets
Hybrid scheme assets included in this publication are:
-
any DC assets held by DC members of the scheme
-
any DC assets held by DB members of the scheme, for example, additional voluntary contributions
Only hybrid schemes with a recent valuation were included:
-
for non micro hybrid schemes this is within the last five years
-
for micro hybrid schemes this was within the last three years
As part of our data validation process, data outliers were identified and either confirmed or corrected by the scheme.
Reported micro scheme assets
Only non RSS/EPP micro schemes are in scope for micro scheme asset statistics. We have also removed micro schemes who have not submitted a valuation in the last five years, and micro schemes with outlier asset values.
Outlier assets values are defined as schemes which have:
-
assets exceeding £1 billion
-
assets per memberships which has increased or decreased by 10 times compared to the most recent submission (typically three years previously)
As a result of removing micro schemes who have not submitted a valuation in the last five years and outliers, 19% of otherwise in-scope schemes are excluded from the statistics.
Automatic enrolment
The scheme name received as part of the declaration of compliance is matched to our scheme returns dataset. Where a match by name is made, we consider the scheme to have been used for AE.
These statistics report on administrative data, and accuracy is addressed by eliminating data errors as far as possible.
Potential sources of error include:
-
employers entering data incorrectly as part of their declaration or re-declaration of compliance
-
matching activities incorrectly filtering out occupational DC pension schemes
-
data processing while creating structured datasets from the declaration of compliance input and any manual corrections as part of that process
Amounts leaving schemes
Memberships (and their assets) leaving a scheme are primarily caused by:
-
members retiring and taking benefits
-
membership transferring to another scheme
There may be other reasons such as a short service refund or deceased members.
As with assets and contributions, not all schemes have supplied the amounts leaving schemes. In the data sections, we show information for the reported amounts leaving schemes, and the number of memberships in schemes that have reported their leaver amounts.
Transfers into schemes
Data on assets leaving schemes, members leaving schemes and assets transferred into schemes, has not been provided by all schemes. Data shown is as reported and has not been imputed for missing values.
Transfer data is only included in the annex tables.
Asset changes
Asset changes are made up of contributions (including transfers in) and investment returns. They are reduced by charges, retirements and transfers out.
Glossary
Automatic enrolment (AE)
By law, every employer with at least one member of staff has duties, including enrolling those who are eligible into a workplace pension scheme and contributing towards it. This is called automatic enrolment because it is automatic for staff – they don’t have to do anything to be enrolled into a pension scheme, but it is not automatic for employers.
Decumulation options
A scheme offering a lifetime annuity purchases an annuity in the name of the trustees at the point of retirement, and then facilitates payment of that annuity to the member. A scheme offering self-annuitisation will calculate an annuity payment for the member and make the payment to the member directly from scheme funds. If the member uses the fund they have built up to purchase an annuity in their own name then they cease to be a member of the scheme. Pensions drawdown (or income drawdown) is another decumulation option in which the pension is kept invested and the member is able to withdraw an income directly from their pot.
You can find information about decumulation options in Section 1: Schemes and Section 2: Memberships.
Dependants
In DC schemes that operate self-annuitisation or lifetime annuities, a member may have the option to purchase a joint life annuity. In this case, a nominated dependant will receive a proportion of the member’s retirement income for the rest of their life, should the member die before the dependant. Membership figures collected reflect those members who are relevant for calculation of the pension levy. As dependants are not included in this, they are not reported to us and so are not included in the statistics in this release.
Effective date
A scheme’s effective date is the date which the data refers to. Memberships, assets and scheme characteristics all refer to the values on the scheme’s effective date.
Executive pension plan (EPP)
An EPP is a scheme:
-
in relation to which a company is the only employer and the sole trustee
-
the members of which are either current or former directors of the company and include at least one third of the current directors
Hybrid schemes
DC trust focuses on occupational DC schemes, as well as any DC memberships in hybrid: dual-section schemes.
There are many varieties of hybrid schemes, but they can broadly be classed as either mixed benefit or dual-section:
- a mixed benefit scheme offers one set of benefits, which has elements of both defined benefit (DB) and DC schemes, such as a DC scheme with an underpin on a DB basis
- a dual-section scheme has two sections - one offering DC benefits and the other offering DB benefits
Master trusts
A master trust is defined as an occupational pension scheme that:
- provides money purchase benefits (whether alone or in conjunction with other benefits)
- is used, or intended to be used, by two or more employers
- is not used, or intended to be used, only by employers that are connected with each other
- is not a relevant public service pension scheme
A master trust may also be a group of schemes, none of which are already master trusts, which provide money purchase benefits, and where each scheme in the group is under ‘common control’ with other schemes in the group. We refer to this group of schemes as ‘cluster schemes’ in our master trust code of practice.
Member
This definition is as per section 151 of the Finance Act 2004. In this publication “member” in relation to a pension scheme, means any active member, deferred member or pensioner member. There is no statutory definition of membership. In this publication, member and membership are synonyms and its accepted meaning is being one of the classes of member listed above.
Micro schemes
A micro scheme is a scheme with 2 to 11 memberships.
Member status
|
Active |
Deferred | Pensioner |
|---|---|---|
| In relation to an occupational pension scheme, means a person who is in pensionable service under the scheme, | In relation to an occupational pension scheme, means a person (other than an active or pensioner member) who has accrued rights under the scheme | In relation to an occupational pension scheme, means a person who in respect of his pensionable service under the scheme or by reason of transfer credits, is entitled to the present payment of pension or other benefits |
| Funds continue to be invested | Funds continue to be invested | Funds can remain invested if the scheme operates a decumulation option |
| Funds continue to attract charges | Funds continue to attract charges | Funds can continue to attract charges if the scheme operates a decumulation option |
The number of memberships does not equate to the number of individuals, as one individual can have multiple memberships.
Relevant small schemes (RSS) – formerly known as small self-administered schemes (SSAS)
An RSS is a scheme where:
- the scheme has fewer than 12 memberships
- all members are appointed as trustees to the scheme or all members are directors of the company, which is the sole trustee of the scheme
- the scheme’s rules provide that any decisions to be made by the trustee(s) are made by unanimous agreement of (a) the trustees who are members of the scheme or (b) directors of the corporate trustee who are members of the scheme, or the scheme has a trustee / corporate trustee / director who is independent in relation to the scheme for the purposes of section 23 of the Pensions Act 1995 and is registered on our trustee register
Scheme status
Pensioner memberships
The data in this publication does not capture all pensioner memberships. Some members will have retired but transferred out of the scheme.
Contact
If you have a specific enquiry about our occupational DC schemes 2025 official statistics, please contact: evidenceandinsight@tpr.gov.uk