Moving from geometric to arithmetic averaging of performance figures
The value for money (VFM) framework intends to capture value holistically. As such, it measures both shorter- and longer-term performance of an arrangement at each ‘years to retirement’ (YTR) point being assessed.
The 2026 consultation proposed a shift from geometric to arithmetic averaging of annual performance figures to calculate multi-year investment performance metrics. The resultant multi-year metrics calculate the typical annual performance of members when passing through specific parts of their savings journey. This update aims to clarify the intention behind this proposal.
Published: February 2026
Options we considered
In the context of defined contribution pensions, there are different ways of interpreting what ‘long-term performance’ may mean. If we look at the 5YTR point, and the 10-year time period, there are three main approaches we could take:
- Approach 1 (proposed in the CP24/16 consultation): this aims to measure the long-term performance of a single investment strategy at a given YTR point. However, it assumes the strategy stays the same over time, which is unrealistic.
- Approach 2: this approach follows one group of members over time. This may place additional data burden on trustees / investment governance committees, and doesn’t isolate performance at a given YTR point.
- Approach 3 (proposed in the CP26/1 consultation): this measures the typical annual experience of multiple groups of members at a given YTR point, over time. It maintains focus on a single YTR point (unlike Approach 2) and works even as strategies change (unlike Approach 1).
In the following sections, we expand on our analysis of the strengths and weaknesses of these three approaches.
1. Long-term performance of a specific portfolio
At 5YTR members will be invested in an investment strategy that will be specific to that point in the retirement journey. We could measure the long-term performance of that investment strategy, regardless of how long those members will have been invested in it.
The CP24/16 consultation aimed to do this, by defining long-term performance as the geometric average of the annual performance of multiple peer groups as they each pass through a given YTR point. By peer group, we mean a group of members with the same target retirement date, who therefore always share the same investment strategy. If these peer groups each experience the same underlying asset mix, geometric averaging does equate to the long-term performance (annualised) of said asset mix.
However, if the underlying asset mix is different between different peer groups, then each peer group’s performance at 5YTR is no longer specific to a given asset mix. This can be true when lifestyling strategies are changed, or for dynamically managed target date fund strategies, where they do not mechanically evolve into the asset allocations of previous vintages. Geometric averaging would measure the annualised performance (ignoring all contributions) of a hypothetical member that has been ‘stuck’ at a single point in the retirement journey over the long term. We deemed that assessing VFM based on metrics that describe an impossible scenario was undesirable.
2. Long-term experience of a specific peer group
We could measure the performance experienced by actual members (ignoring all contributions) who are currently at 5YTR, in the 10 years leading up to it.
This would avoid the unrealistic scenario depicted above, but would introduce the following:
Additional burden:
In the early years of the framework, this approach may be burdensome (especially for lifestyling arrangements).
Potential unintentional consequences:
At 5YTR and 0YTR, this approach would measure much (or all) of the pre-retirement ‘de-risking’ path, not just performance at the YTR point.
Unlike an approach focussed on specific YTR points, where the differences in risk levels would be immediately apparent, an approach that measures the cumulative effect of a long-term derisking path may obfuscate the exact nature of the derisking strategy, and may incentivise simplistic decisions (such as delayed derisking) solely for the purpose of flattering VFM metrics (as opposed to a legitimate decision to de-risk later, where trustees / IGCs deem it to be in the best interest of members).
3. Typical annual experience over the period
We could measure the average annual performance experienced by members as they pass through the 5YTR point, over the previous 10 years.
This approach, put forward in the 2026 consultation as a means to address the flaws and concerns with the previous options, requires arithmetic averaging of annual performances at each YTR point. It is no longer a measure of long-term performance of a single portfolio, or of a single peer group as it ages through time. Instead, it treats each annual performance experienced by different peer groups as a discrete event, and aims to assess what was the typical experience of different members in different years as they each passed through a single point in the retirement journey.
Moving forward
We believe that each approach has strengths and weaknesses. We are now asking stakeholders to share their views on our proposal, and on whether it strikes the right balance between:
- calculation burden
- realistic and reliable measure of performance
- the behaviours or incentives it may create
A technical description of the options considered
If we take the 5YTR point, and wish to calculate the 10y performance, the possible approaches described above either use different data, or different averaging approaches:
|
Year |
YTR |
||||
|---|---|---|---|---|---|
|
5 |
6 |
7 |
… |
14 |
|
|
2025 |
A% |
||||
|
2024 |
B% |
β% |
|||
|
2023 |
C% |
γ% |
|||
|
… |
… |
||||
|
2016 |
G% |
η% |
|||
In the table above, the series of data A, B, C etc represents the annual performance experienced by whichever peer group was at 5YTR in 2025, 2024, 2023 etc respectively. If the investment strategy producing these annual returns had always been the same, calculating the geometric average of the figures yields the long-term performance of said investment strategy:

Where the strategy changes in different years, the resulting geometric average no longer represents the long-term performance of any given investment strategy.
The series of data A, ββ,γγ etc represents the annual performance experienced by the peer group which is at 5YTR in 2025, and was previously at 6YTR in 2024, at 7YTR in 2023 and so on. Calculating the geometric average of these figures yields the long-term performance experienced by this peer group:

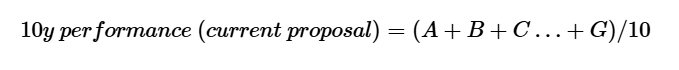
Conversely, given possible concerns identified above, an alternative is to shift the focus to the long-term (10y) average of short-term (annual) performance. We can arithmetically average the series of data A, B, C etc: