Diversity pay gap report 2025
Our Diversity pay gap report 2025 brings together data and analysis on our gender, disability, ethnicity, and sexual orientation pay gaps.
This report includes our mandatory gender pay gap report, which we are legally required to publish on an annual basis.
Published: 25 March 2026
Executive Summary
Equality, diversity and inclusion (EDI) shape how we work every day. We want to be a diverse and inclusive employer and regulator, making sure workplace pensions work well for everyone. Our 2025 diversity pay gap report shows encouraging progress, while highlighting where we still need to go further.
Different perspectives strengthen our work and help us perform at our best. We are committed to attracting, supporting and retaining talented people from all backgrounds. As a regulator, we also work with others to reduce inequalities by improving accessibility and promoting inclusive governance across pension schemes.
Our work is guided by the Public Sector Equality Duty. We are currently finalising the next phase of our EDI approach, with reducing pay and bonus gaps remaining a key priority.
Our 2025 data shows positive movement in several areas, alongside clear opportunities for further action.
In 2024 we introduced changes to make our pay approach fairer, simpler and more consistent. Although the 2025 data does not yet reflect these changes, they will help shape future outcomes.
Key changes since 2024
- Ethnicity: The pay gap has narrowed for the fourth consecutive year, though it remains higher than we would like. The bonus gap has also reduced, with the median favouring minority ethnic employees.
- Disability: Pay and bonus gaps continue to favour disabled employees, extending a positive longer-term trend linked to increased representation at senior levels.
- Gender: The mean pay gap is stable, while the median has widened, reflecting changes in representation of women across pay quartiles. The bonus gap has decreased for the third year running.
- Sexual orientation: Results are mixed, influenced in part by lower disclosure rates. The median pay gap has reduced while the mean increased slightly. Bonus gaps have widened, although a higher proportion of LGB+ colleagues received a bonus.
We can see that unbalanced representation – particularly in senior and higher‑paid roles – remains the biggest driver of pay gaps for women, LGB+ and minority ethnic colleagues.
We know that better data helps us take better action, so improving declaration rates remains an important focus, especially for disability, ethnicity and sexual orientation where they have not significantly changed.
We review pay annually and in the 2025-26 pay award we narrowed our pay bands, introduced a standard pay point for all but the most senior bands and introduced guided distribution. We also strengthened our approach to bonus distribution to support fairness, consistency and transparency – bonuses remain linked to exceptional performance and awards are now based on the standard pay point for each pay band.
Fairness does not happen by accident – closing our diversity pay gaps will take sustained action. While this year’s findings are a step forward, it’s not the destination – and we will not stand still. We will keep building on this momentum, taking practical steps to close our pay gaps and build a more inclusive and equitable organisation.
We will continue to:
- improve data collection and quality
- embed our new approach to pay
- strengthen representation by supporting under‑represented talent to progress and introducing clearer career pathways
Together, these actions will help us build a workplace where everyone feels valued and able to succeed.
Introduction
Overview of Gender pay gap reporting
Since 2017, organisations with 250+ employees have been required to publish gender pay gap data under the Equality Act 2010 (Specific Duties and Public Authorities) Regulations. As a public body, TPR is included in this requirement and is required to report on:
- mean gender pay gap
- median gender pay gap
- mean gender bonus gap
- median gender bonus gap
- proportion of men and women receiving a bonus
- proportion of men and women in each pay quartile
Gender pay gaps are different from equal pay. Equal pay is a legal requirement; we use job evaluation to ensure work of equal value is paid equally.
This report reflects data as at 31 March 2025.
What the gender pay gap measures
The gender pay gap shows the difference in average earnings between men and women across an organisation.
- Mean gap: difference between average hourly pay; affected by outliers.
- Median gap: difference between the middle values; often more representative.
Pay gaps are expressed as percentages. Positive percentages indicate women are paid less on average; negative percentages show women are paid more.
Bonus gaps compare average bonus amounts and the proportions of men and women receiving a bonus. Pay quartiles show representation across four equal pay bands.
Overview of pay gap reporting on disability, ethnicity, and sexual orientation
We voluntarily report on disability, ethnicity and sexual orientation pay gaps as part of our commitment to transparency. We use the same methodology as for gender, comparing:
- disabled and non‑disabled colleagues
- minority ethnic and white colleagues
- LGB+ and heterosexual colleagues
These characteristics rely on voluntary self‑declaration. As a result, data sets may be smaller and less complete, making median figures more reliable. Improving declaration rates remains a key priority.
Overview of Civil Service comparisons
We compare our gender and disability pay gaps with wider Civil Service data (as at 31 March 2025). Direct ethnicity comparisons are not possible due to differences in how data is categorised, and the Civil Service does not publish sexual orientation pay gap data.
Gender pay gap report
Gender representation at TPR
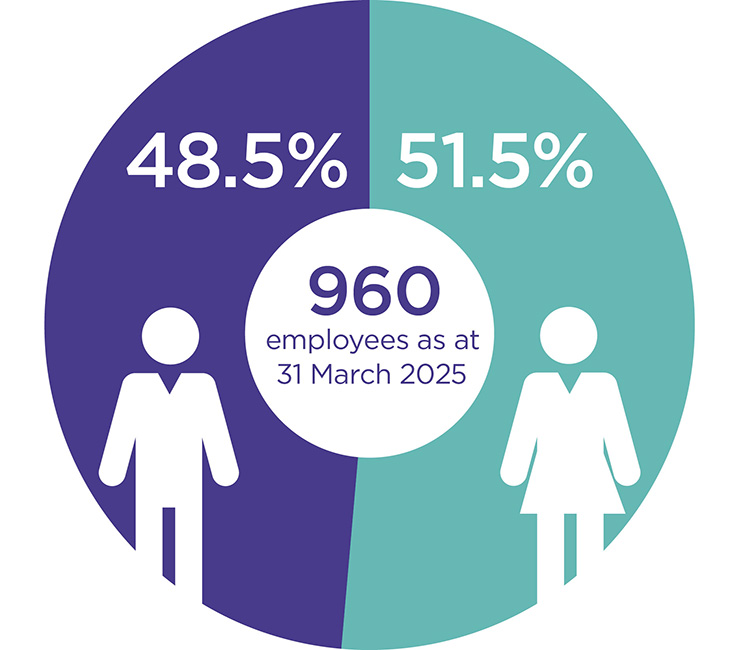
We hold gender data for 100% of our workforce as at 31 March 2025.
The data shows a gender balance of 51.5% of women and 48.5% men.
In the Civil Service, 54.6% are women.
Mean and median gender pay gap
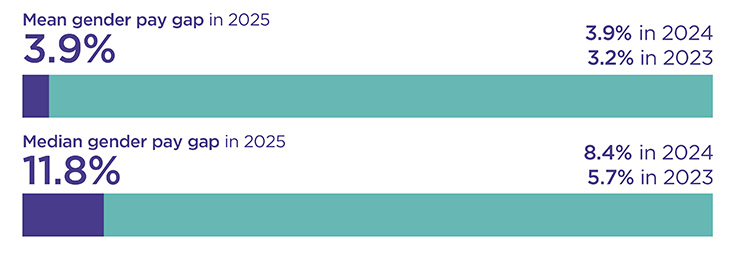
Our mean gender pay gap for 2025 remains unchanged at 3.9%, while the median gap has increased to 11.8% (from 8.4% in 2024) in favour of men. Movement in the median but not the mean indicates broader workforce changes, such as promotions or pay adjustments at mid-level positions, while outliers in the highest earning roles do not change significantly. This reflects the few changes we saw in our ‘upper’ quartile for this data period, as opposed to a 1% increase in men in the ‘upper middle’ quartile.
We continue to compare favourably to the Civil Service mean gender pay gap of 6.9%, but our median gender pay gap is now higher than the Civil Service median of 6.4%.
Mean and median gender bonus gap
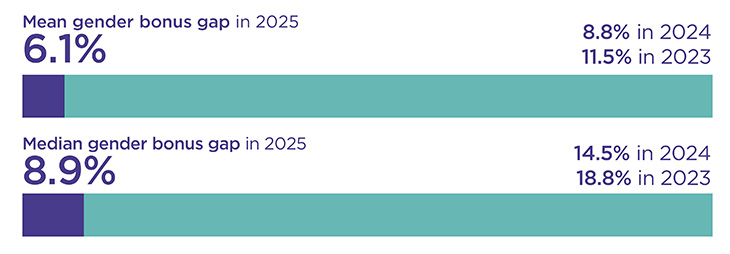
Our mean gender bonus pay gap decreased to 6.1% (from 8.8% in 2024), while the median gap decreased to 8.9% (from 14.5% in 2024), continuing a 3-year downward trend and marking significant reductions compared to 2024.
The reduction in the gaps is largely due to changes to the bonus scheme, under which bonuses are now calculated as a percentage of the salary midpoint rather than individual salaries. This ensures that employees at the same grade with the same performance rating receive equivalent bonus amounts. We expect the introduction of guided distribution for performance ratings will support fairness and consistency.
While we are encouraged by this progress, a gender bonus gap remains, despite a higher proportion of women receiving bonuses than men.
The gap is partly due to structural factors including the greater representation of men in senior, higher paid roles, which lead to larger bonus values. The higher proportion of women working part time (footnote 1), results in pro rated bonus calculations that reduce overall amounts.
We compare favourably with the Civil Service, where the mean gender bonus pay gap is 22.5% and the median gender bonus gap is 14.3%.
The proportion of men and women receiving bonus pay
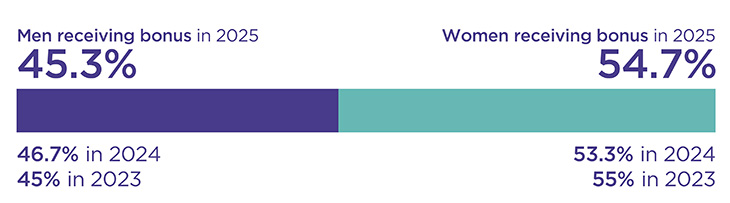
A higher proportion of women received a bonus than men, with 54.7% of women receiving a bonus compared to 45.3% of men. This pattern mirrors the wider Civil Service, where 72.6% of women received a bonus compared to 67.3% of men.
This continues a 3-year trend of more women than men receiving bonus payments at TPR, indicating our performance management approach does not reinforce inequalities, and our focus should be on recruiting more women into senior roles and aligning salaries to the standard pay point.
The proportion of men and women in each pay quartile
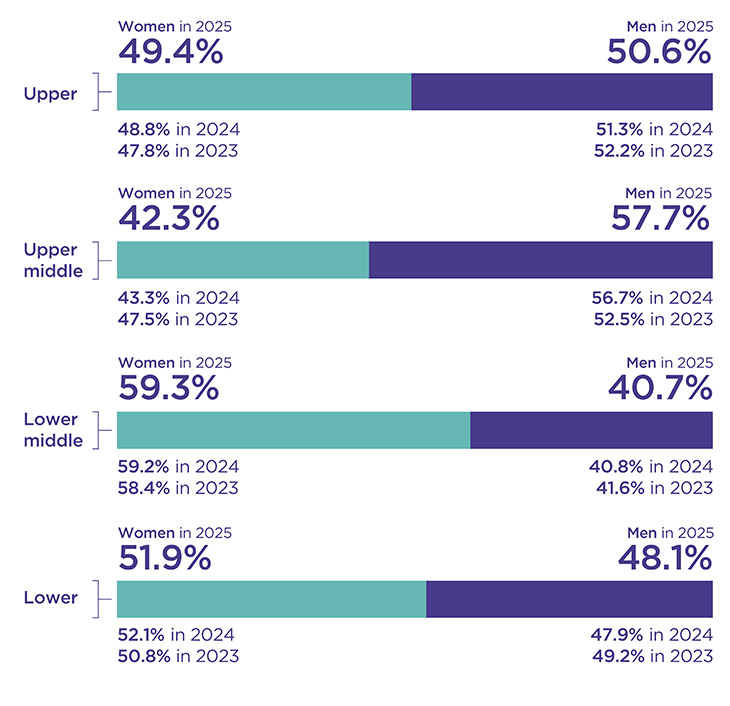
There is a lower proportion of women in the higher quartiles (42.3% women compared to 57.7% men in the upper middle quartile, and 49.4% women compared to 50.6% men in the upper quartile) and a higher proportion of women in the lower quartiles (51.9% women compared to 48.1% men in the lower quartile, and 59.3% in the lower middle quartile compared to 40.7% men). This distribution contributes to the median gender pay and bonus gaps favouring men.
This pattern reflects the Civil Service where there is a lower proportion of women in the upper quartile (48.1% women compared to 51.9% men) and a higher proportion of women in the lower quartile (61.1% women compared to 38.9% men).
Although we employ more women than men overall, pay and bonus gaps are largely driven by this imbalance. The most impactful progress in reducing these gaps will come from improving women’s representation at senior grades.
Disability pay gap report
Disability representation at TPR
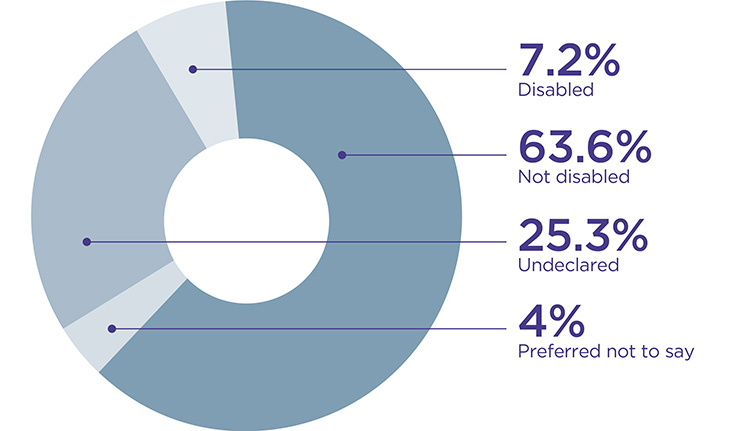
We hold disability data for 74.7% of our workforce as at 31 March 2025.
Of those who shared information:
- 7.2% have declared a disability
- 63.6% have indicated they do not have a disability
- 4.0% responded ‘prefer not to say’
- 25.3% did not share their data
Our analysis compares the data we hold for the disabled and non-disabled categories – the ‘prefer not to say’ data is removed from the calculation.
In the Civil Service 17.9% declare themselves as having a disability in 2025.
Mean and median disability pay gap
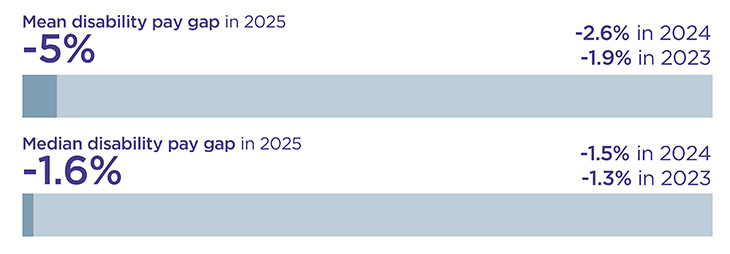
Our disability pay gaps show hourly pay remains favourable to employees who have declared a disability. Our mean disability pay gap increased to -5.0% (from -2.6% in 2024) and the median gap increased to -1.6% (from -1.5% in 2024), and both remain in favour of employees with a disability, continuing a 4-year trend. This is largely due to the representation of disabled people at senior levels.
We compare favourably to the Civil Service mean disability pay gap of 7.5% and median disability pay gap of 8.0%.
Mean and median disability bonus gap
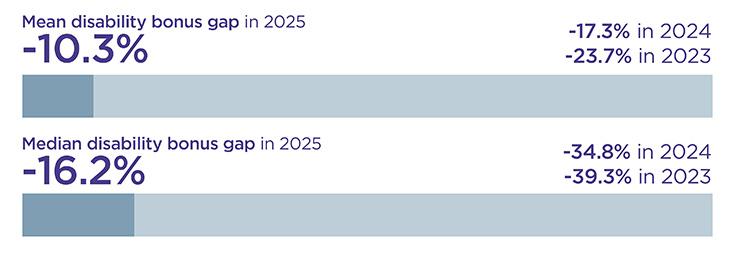
Our disability bonus gap has continued to reduce since 2024. The mean disability bonus gap decreased to -10.3% (from -17.3% in 2024) and the median gap has decreased to -16.2% (from -34.8% in 2024), both in favour of employees who have declared a disability. These results continue a 3-year trend narrowing the gaps. This means that, among those who received a bonus, disabled employees typically received higher bonuses than non disabled employees.
These figures compare very favourably to the Civil Service mean disability bonus gap of 24.4% and median disability bonus gap of 24.0%.
The proportion of disabled and non-disabled employees receiving bonus pay
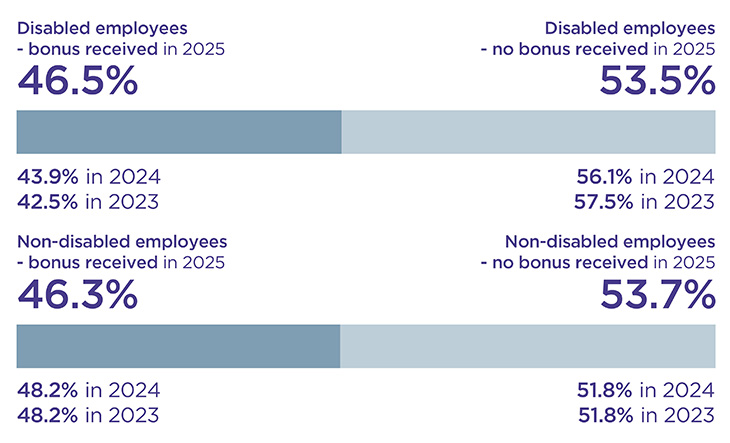
The proportion of disabled employees receiving a bonus increased to 46.5% (from 43.9% in 2024) and the percentage of non-disabled employees receiving a bonus decreased to 46.3% (from 48.2%), showing both groups are equally likely to receive a bonus.
In the Civil Service, disabled people are slightly more likely to receive a bonus (75.2%) compared to non-disabled people (73.1%).
The proportion of disabled and non-disabled employees in each pay quartile
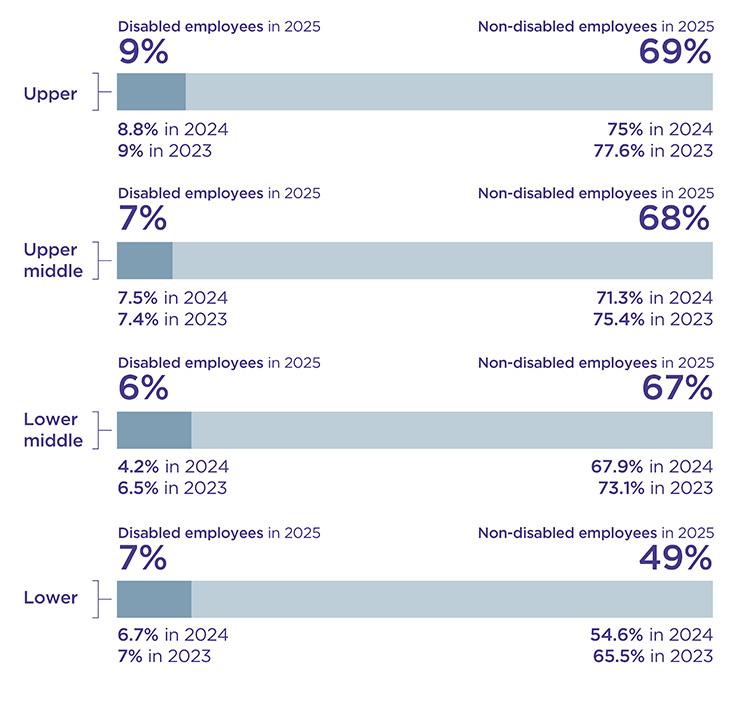
There is a lower proportion of disabled employees across all four quartiles compared to non-disabled employees. The highest proportion of disabled employees is in the upper quartile, which contributes to disability pay and bonus gaps favouring disabled employees. As of September 2025, we have exceeded our targets of disability representation at TPR (12.7% at senior levels against a target of 7%, and 8% at an organisational level against a target of 7%).
This is different to the Civil Service where there is a higher proportion of disabled employees in both the lower quartiles, and a lower proportion in both the upper quartiles.
Ethnicity pay gap report
Ethnicity representation at TPR
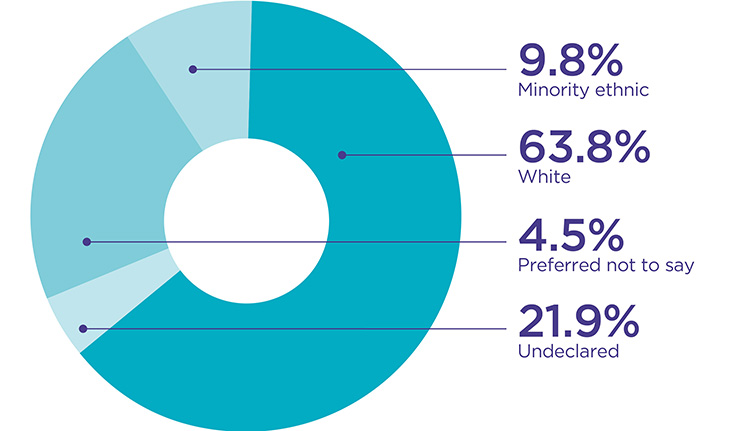
We hold ethnicity data for 78.1% of our workforce as of 31 March 2025.
Of those who shared their information:
- 9.8% of our workforce identified as minority ethnic (footnote 2)
- 63.8% identified as white
- 4.5% responded ‘prefer not to say’
- 21.9% did not share their data
Our analysis compares the data we hold for the minority ethnic and white categories - the ‘prefer not to say’ data is removed from the calculation.
Mean and median ethnicity pay gap
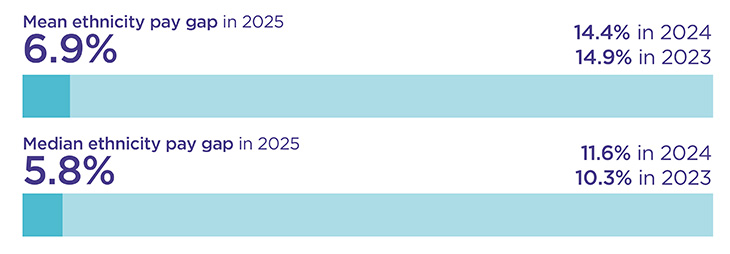
Our ethnicity pay gaps have both shown significant improvements compared to 2024. The mean gap has decreased to 6.9% (from 14.4%), and the median gap decreased to 5.8% (from 11.6%). While both gaps remain in favour of white employees, and minority ethnic employees continue to earn less per hour, this shows positive and sustained progress in reducing disparities over the last three years.
Mean and median ethnicity bonus gap
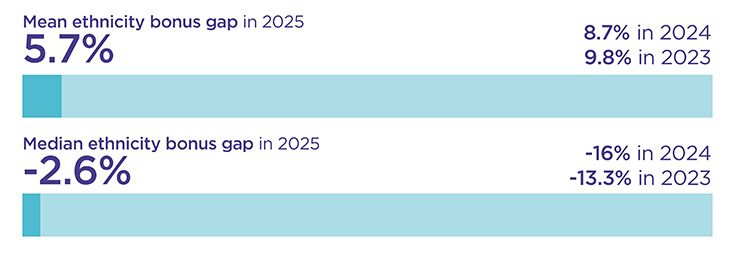
Our ethnicity bonus gaps have both shown significant improvement compared to 2024. Our mean ethnicity bonus pay gap decreased to 5.7% (from 8.7% in 2024) in favour of white employees, and our median ethnicity bonus pay gap decreased to -2.6% (from -16.0%) in favour of minority ethnic employees. This shows a positive trend and sustained progress in reducing disparities over the last three years.
The proportion of minority ethnic and white employees receiving bonus pay
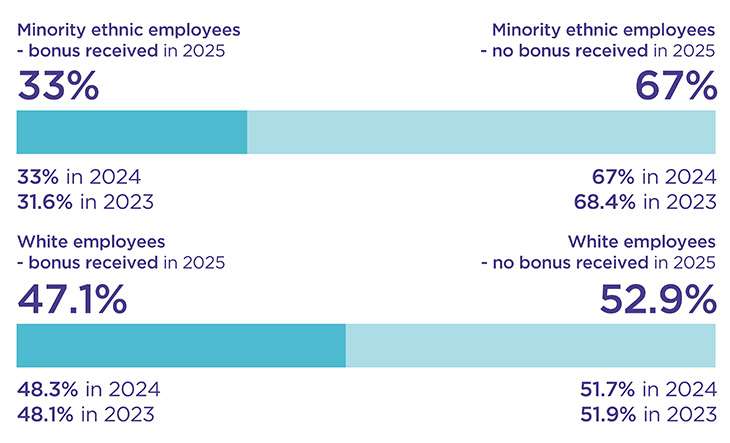
The proportion of minority ethnic employees receiving a bonus remained unchanged at 33.0%, while the proportion of white employees receiving a bonus decreased slightly to 47.1% (from 48.3% in 2024). White employees are still more likely to receive a bonus.
The proportion of minority ethnic and white employees in each pay quartile
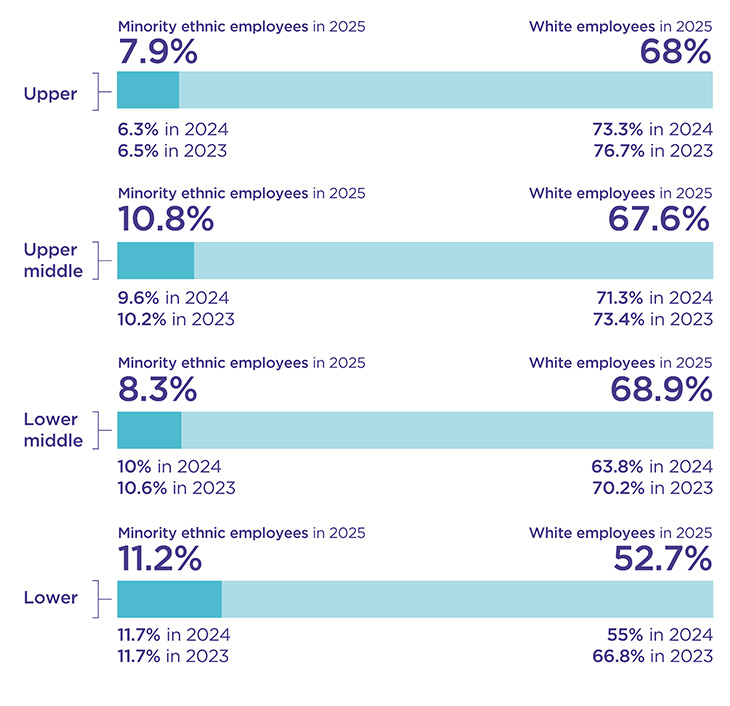
There is a lower proportion of minority ethnic employees across all four quartiles compared to white employees. The highest proportion of minority ethnic employees is in the lower quartile, which contributes to the ethnicity pay and bonus gaps favouring white employees. We are pleased to see slight increases in the number of minority ethnic employees in the upper and upper-middle quartiles compared to 2024, though we recognise we have further to go to improve representation at senior levels.
Sexual orientation pay gap report
Sexual orientation representation at TPR
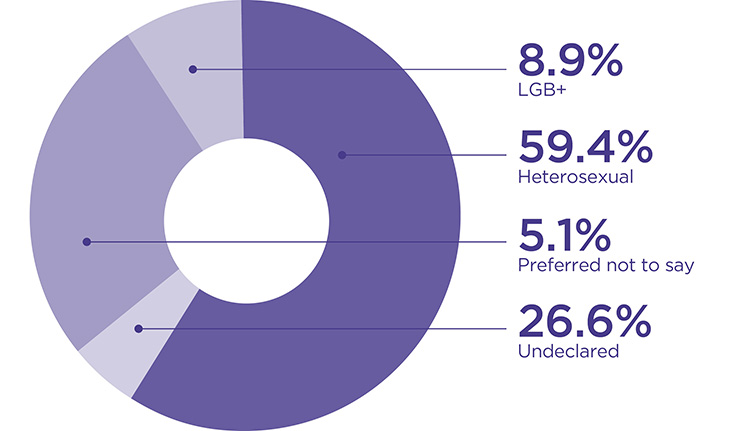
We hold sexual orientation data for 73.4% of our workforce as of 31 March 2025.
Of those who shared their information:
- 8.9% of the workforce identified as gay, lesbian or bisexual or recorded their sexual orientation as ‘other’ (LGB+)
- 59.4% identified as heterosexual
- 5.1% responded ‘prefer not to say’
- 26.6% did not share their data
Our analysis is based on the data we hold for the LGB+ and heterosexual categories – the ‘prefer not to say’ data is removed from the calculation.
Mean and median sexual orientation pay gap
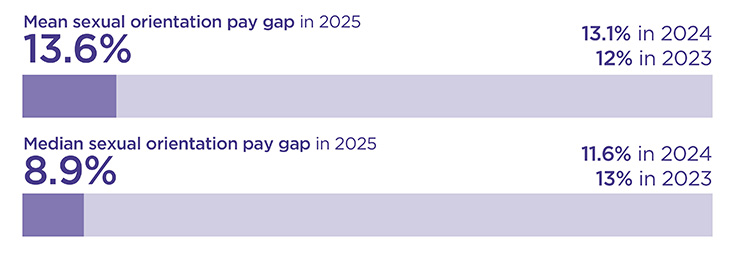
Our sexual orientation pay gaps have both shown changes since 2024. Our mean sexual orientation pay gap increased slightly to 13.6% (from 13.1% in 2024) in favour of heterosexual employees, and our median sexual orientation pay gap decreased to 8.9% (from 11.6% in 2024), though still in favour of heterosexual employees. This is primarily due to low LGB+ representation at senior levels.
Mean and median sexual orientation bonus gap
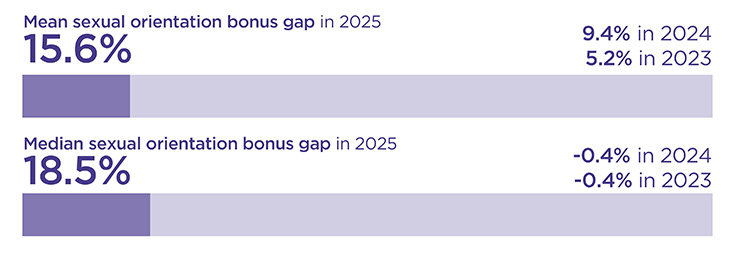
Our sexual orientation bonus gaps both widened compared to 2024. Our mean sexual orientation bonus gap increased to 15.6% (from 9.4% in 2024) and our median sexual orientation bonus gap increased significantly to 18.5% (from -0.4% in 2024), both favouring heterosexual employees. Due to the small number of staff within these categories, especially when further segmented by pay grade and other factors, we have been unable to draw meaningful conclusions about the reasons for this change.
The proportion of LGB+ and heterosexual employees receiving bonus pay
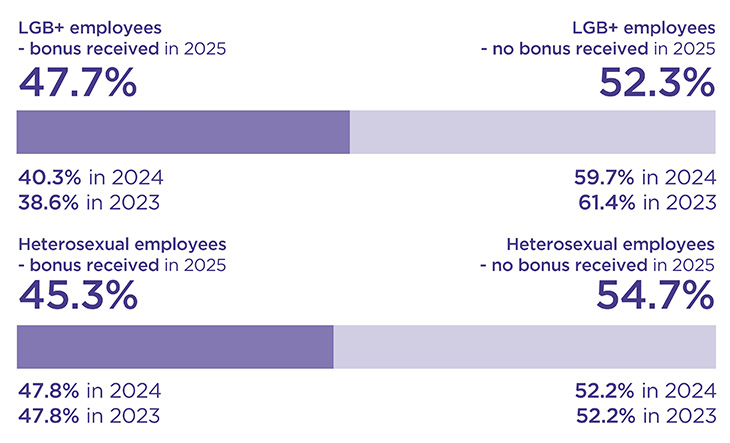
The proportion of LGB+ employees receiving a bonus increased to 47.7% (from 40.3% in 2024) and the proportion of heterosexual employees receiving bonus pay decreased to 45.3% (from 47.8% in 2024), showing that LGB+ employees are more likely to receive a bonus that heterosexual employees.
The proportion of LGB+ and heterosexual employees in each pay quartile
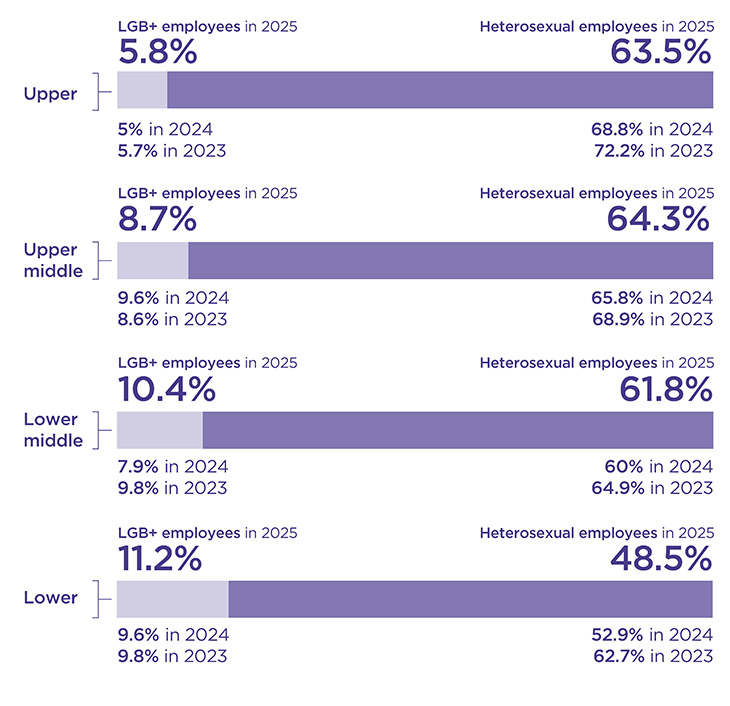
There is a lower proportion of LGB+ employees across all four quartiles compared to heterosexual employees. The highest proportion of LGB+ employees is in the lower quartile, which contributes to LGB+ pay and bonus gaps favouring heterosexual employees. However, as indicated previously, only 73.4% of employees have shared their sexual orientation data, 5.1% of which is ‘prefer not to say’.
Taking action on our diversity pay gaps
Key actions taken over the last year
Data quality
Our September 2025 'Count me in' campaign increased declaration rates slightly, improving data reliability, though further progress is needed.
Recruitment
We strengthened our recruitment approach by:
- using diverse panels for senior roles and broader advertising
- launching a Candidate Charter
- holding campaign planning meetings focused on diversity
- launching a new applicant tracking system with diversity monitoring
Learning and development
We delivered 'Inclusive Recruitment for Hiring Managers' through the Manager Learning Pathway, with ongoing delivery through 2026–27. All new colleagues continue mandatory Civil Service EDI learning.
Pay
Following extensive consultation, we refined our Reward Strategy and implemented a new approach to pay, designed to be fairer, simpler, and better aligned to roles.
Performance
We introduced a balanced scorecard for senior leaders, refreshed our objective setting approach and implemented guided distribution for performance ratings, to support consistent performance assessment.
Policy
We continued our annual review of people policies, supported by Equality Impact Assessments and advice from our EDI Team and Diversity Networks.
Future actions to improve our pay gaps
Our priorities remain improving data quality, embedding our new approach to pay and supporting career development.
EDI
We will continue work to reduce gender, ethnicity and sexual orientation gaps and maintain our positive disability gap by:
- implementing our new approach to pay
- providing more detailed EDI data to leaders
- offering ongoing learning on equality and inclusion
- reviewing people policies
- encouraging colleagues to update their data
We will continue to support our diversity networks.
Data
We aim to increase declaration rates for disability, ethnicity and sexual orientation by four percentage points by March 2027. We will continue sharing insights with Executive Directors, informed by data from our applicant tracking system.
Recruitment
We will use applicant tracking system insights to monitor candidate diversity and support targeted action, and we will update guidance for candidates applying under Disability Confident.
Learning and development
We will continue delivering the Manager Learning Pathway and provide wider learning opportunities, including webinars and articles.
Pay
As part of our new approach to pay we have moved from performance related pay to role-based pay and have introduced standard pay points to support fair and consistent pay decisions. Implementation of the new approach, and transition towards the standard pay point, will be phased over several years, with the priority in the first instance being to narrow the distribution of salaries across our pay bands.
Bonus payments remain based on the standard pay point. In March 2025, we introduced a new performance approach linking the top performance ratings directly to bonuses, supported by guided distribution. A review will inform future cycles.
Talent development
We are introducing career development pathways, piloting across three professions before wider rollout in 2026.