Annual Funding Statement Analysis 2023
A review of defined benefit (DB) pension schemes with valuation dates between September 2022 and September 2023 (Tranche 18 or T18 valuations).
Published: 13 June 2023
Introduction
This analysis of the expected positions of DB pension schemes with valuation dates between 22 September 2022 and 21 September 2023 (known as Tranche 18 or T18) gives further context to our 2023 Annual Funding Statement (AFS) but does not supersede it. The analysis is necessarily technical in nature and primarily aimed at a more technical audience than the main 2023 AFS.
In modelling the impacts of market conditions on the DB scheme universe, we have made several approximations based on the high level and limited data we hold, which means we cannot take account of all scheme-specific characteristics. The method and simplifications we have made are contained in the methods, principal assumptions and limitations section. The position of individual schemes will vary, depending on a number of individual factors not considered here.
For schemes that have not yet reached their long-term funding target and hence are reliant on the employer covenant, the strength of the employer covenant is a key consideration for trustees and employers when setting their funding strategies. In previous years’ analyses we have shown trends in potential employer affordability. This analysis was based on historic, publicly available information on profit, shareholder funds and dividend payments. Given the significant and uneven impact of the COVID-19 crisis on scheme employers, the subsequent inflationary and supply chain impacts of the war in Ukraine and then higher interest rates, for many schemes, recent trends in employer affordability based on historic data are likely to be of limited use in assessing employer affordability today. Consequently, we have again excluded trends in employer affordability from this year’s analysis. We have also again excluded data showing segmentation of T18 schemes into the AFS categories (A to E) as this data is also based on historic assessments of employer covenant.
The remaining analysis is similar to the analysis carried out in previous years.
This material and the work involved in preparing it are within the scope of and comply with the Financial Reporting Council’s Technical Actuarial Standard 100. For the purpose of this standard, the users of this material are considered to be the trustees of the DB schemes whose funding we regulate, the employers who fund those schemes, and their actuarial advisers.
Summary
Market conditions and impacts on scheme funding levels
Our analysis shows that the major asset classes invested in by UK pension funds experienced a wide variety of return profiles over the three years to 31 December 2022 and the three years to 31 March 2023.
For example, over the period from December 2019 to December 2022, the FTSE All World (excluding UK) Index returned +27% in sterling terms, and for the period March 2020 to March 2023 the return was +56%. However, the return on FTSE British Government fixed over 15 years index was -37% over the three years to December 2022, and for the period March 2020 to March 2023 the return was -42% (see Table 1).
Nominal and real gilt yields were significantly higher at 31 December 2022 and 31 March 2023 than they were three years earlier (see Figures 1 and 2). The effect of this change in gilt yields means the technical provisions (TPs) calculated at a comparable effective date are likely to have reduced significantly over the three years to 31 December 2022 and 31 March 2023.
For the purpose of this analysis as at both 31 December 2022 and 31 March 2023, we have assumed the liabilities are calculated using discount rates that have a lower margin over gilt yields than they had at a scheme’s last valuation date (reflecting lower expected return on assets relative to gilts), which has reduced the effect of the change in yields somewhat.
In practice, the employers’ covenant strength may have changed, which should be reflected in the TPs. Additionally, as mentioned above, many schemes may now have reached their long-term funding target and covenant strength may no longer be a primary factor when setting TP assumptions, although it will remain an important risk and the trustees should not be complacent to it. Neither of these aspects have been reflected in our analysis.
In September and October 2022, the Bank of England (BoE) had to intervene in the gilt market to restore market functioning when sharp and rapid rises in gilt yields led to widespread selling of gilts by pension schemes’ liability-driven investment (LDI) arrangements. We issued a statement on this in April 2023 (LDI Statement). We have made some estimates about the impact of capital calls and rebalancing in LDI portfolios to understand the impact on funding levels. Further details of this are in the methods, principal assumptions and limitations section.
Overall, our modelling also suggests that in aggregate schemes undertaking valuations at 31 December 2022 and 31 March 2023 will show improved funding levels from those reported three years previously and the current recovery plan will be on track to remove the deficit by the end date (see Figures 5a and 5b).
However, the position for individual schemes will vary greatly compared with our aggregate estimates. This variation will depend on scheme-specific inter-valuation experience, valuation dates, funding assumptions and investment strategies. For example, at both 31 December 2022 and 31 March 2023, schemes that had a low hedged position against interest rates have significantly improved funding levels compared to three years ago, compared to hedged schemes. Conversely, funding levels will have fallen for some schemes, including some schemes invested in pooled funds and others unable to meet the necessary LDI collateral calls when gilt yields spiked in 2022. This variation in funding levels is demonstrated in Figures 7a and 7b.
Implications for recovery plans and affordability
Our modelling shows that if all T18 schemes that had 31 March 2023 valuation dates retained their recovery plan end dates, or if schemes nearing the end of their recovery plan increased their plan lengths to three years, 79% of T18 schemes in deficit would be able to retain their deficit repair contributions (DRCs) at the same level or reduce them (see Figure 8). One per cent would need to increase DRCs to more than three times their current level or more.
In practice, economic conditions (including war in Ukraine, COVID-19, Brexit, higher inflation and interest rates) may have impacted the employers’ covenant strength. This should be reflected in the TPs, as well as the large changes in funding levels that some schemes have experienced. It should be noted that this has not been reflected in our analysis. Strengthening the TPs will increase the deficit and, if the recovery plan end date is to be maintained, would lead to higher DRCs than our analysis shows.
Market indicators
Scheme funding is sensitive to the impact of the changes in market conditions on schemes’ assets and the valuation of their liabilities.
Common valuation dates
The end of December and end of March are the most common valuation dates for schemes in this tranche. Therefore, we have concentrated on these dates in this analysis. 5 and 6 April are also common valuation dates. We have not presented analysis at these dates, but market conditions at 5 and 6 April 2023 were similar to those at 31 March 2023.
Bond yields
Figure 1 shows the BoE estimates of nominal and real gilt yields, and implied inflation as measured by the RPI at a 20-year duration at each date from March 2017 to 31 March 2023.
Figure 1: Benchmark yields
Sources: BoE, Refinitiv (financial markets data)
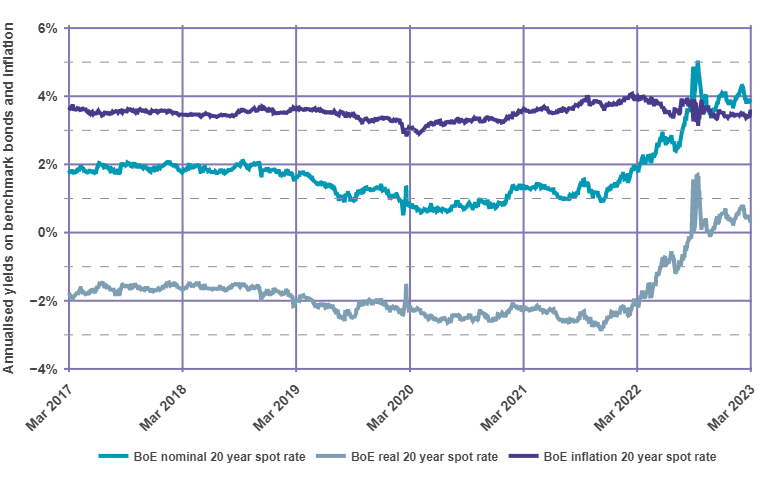
Before March 2022, there had been sustained low gilt yields for a long period of time, but they have risen sharply since then. Long-term real gilt yields fell into negative territory in 2014 and had remained there until September 2022 but are now yielding positive yields again. Nominal yields had fallen in the same fashion but have also increased substantially.
Long-term market-implied inflation has remained mainly between 3%pa to 4%pa over the six-year period, and has not seen large increases despite increases to short term inflation being felt in the economy.
Figure 2 shows the real forward interest rates as estimated by the BoE as at the end of December 2019, March 2020, December 2022 and March 2023.
Figure 2: UK instantaneous real forward gilt curves
Source: BoE
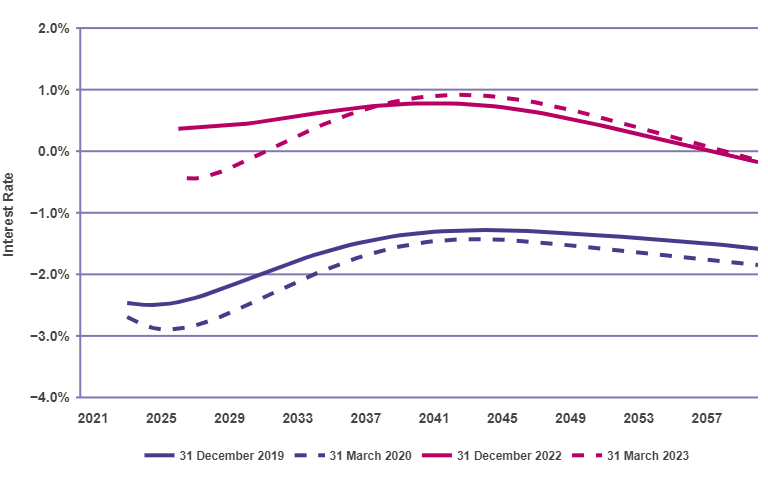
The shape of the curve is reasonably similar at the four dates. However, between 2019/20 and 2022/23 there was a significant increase in real interest rates along the whole curve.
All other things being equal, we expect that if trustees use a discount rate to calculate liabilities that has the same margin above gilt yields at the previous valuation, schemes as at 31 December 2022 and 31 March 2023 will have a significantly lower reported value for their liabilities than they were expecting.
Asset returns
Figure 3 shows total returns for a range of asset class indices since 2017. The indices have been re-based to 100 at 31 March 2020, so the chart shows the relative change up to and from that point.
Figure 3: Asset returns
Source: Refinitiv
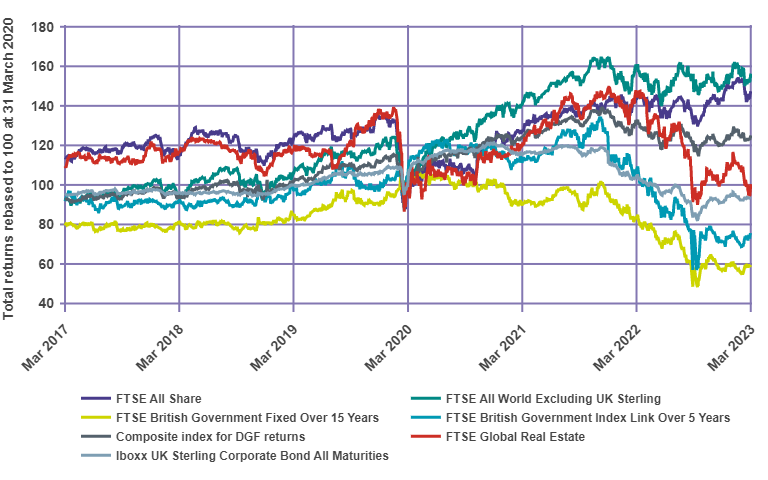
Table 1 shows the total returns in UK Sterling for various asset indices over the periods December 2019 to December 2022 and March 2020 to March 2023.
Table 1: Total returns in UK Sterling from different asset classes over the three years to 31 December 2021 and 31 March 2022
Source: Refinitiv
| Index name (Asset class) | Total returns over the period 31 December 2019 to 31 December 2022 | Total returns over the period 31 March 2020 to 31 March 2023 |
|---|---|---|
| FTSE All Share (UK equities) | 7.10% | 47.40% |
| FTSE All World Excluding UK Sterling (Overseas equities) | 26.50% | 56.30% |
| Iboxx UK Sterling Corporate Bond All Maturities (Corporate Bonds) | -14.20% | -6.90% |
| FTSE British Government Fixed Over 15 Years (Fixed interest gilts) | -36.70% | -41.50% |
| FTSE British Government Index Link Over 5 Years (Index linked gilts) | -27.40% | -25.20% |
| Composite DGF index | 8.20% | 27.20% |
| FTSE Global Real Estate (Property) | -26.20% | 0.40% |
There are fairly large differences between the three year returns to 31 December 2022 and 31 March 2023. This is largely due to the large market turmoil experienced in the final two weeks of March 2020 in the lead up to the first COVID-19 lockdown period. For example, most of the 26.2% fall in FTSE Global Real Estate was experienced in this period but had already happened by 31 March 2020. Therefore, it is not included in the returns for the three years to 31 March 2023, but will feature in the 3 year returns to 31 December 2022.
Over the three-year period between valuations, there was a wide range of asset performance, and for the March period this has been exacerbated by the market volatility surrounding COVID-19 at the start of the period. For example, for growth assets over the three years to 31 March 2023, equities performed well, with the FTSE All Share returning 47.4% compared to 7.1% for 31 December 2022. Returns on protection assets were similar over the three years, with FTSE British Government Fixed Over 15 Years returning -41.5% for the three years to 31 March 2023 and -36.7% to 31 December 2022. Much of this reduction came during the 2022 calendar year and affects both periods.
DB schemes
Funding position of DB schemes in aggregate
Figure 4 shows TPs estimates for all DB schemes, based on rolling back and projecting forward the data we held at 30 September 2022 (rather than using historical data at historical dates). This is an aggregate analysis based on highly summarised data.
Figure 4: Estimated assets and liability positions of DB pension schemes
Sources: The Pensions Regulator (TPR) (scheme data), Refinitiv
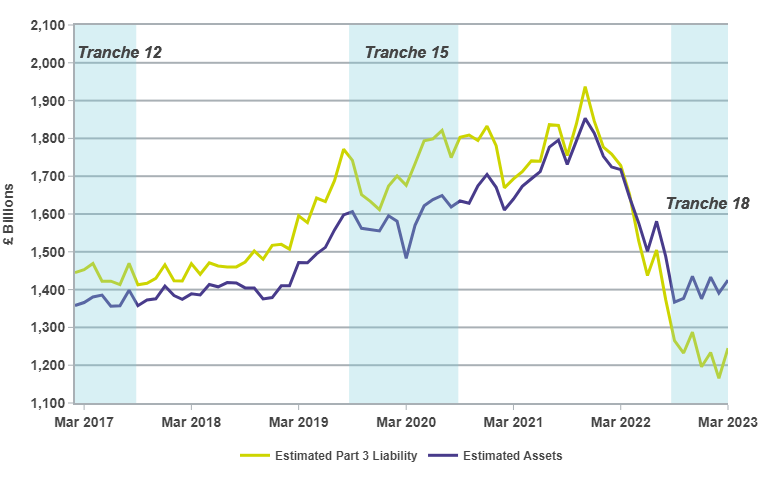
Overall, the changes in market conditions and aggregate pace of schemes’ funding plans mean that deficits on a TPs basis as at December 2019 and March 2020 are expected to have turned into surpluses as at December 2022 and March 2023.
Potential impact on scheme deficits in more detail
The analysis above showed how funding levels have changed for all schemes in the DB universe. This may not be representative of the tranche of schemes undertaking valuations now (T18). Figures 5a and 5b illustrate the key drivers in the change in deficit for all T18 schemes at the two most common valuation dates: 31 December and 31 March.
We have assumed that the discount rates that are used to calculate the liabilities of each scheme have changed since the previous scheme valuations, broadly in line with three factors.
- The movement in real and nominal gilt yields over the period.
- A change in the expected return on assets above the gilt yield.
- The movement in investment portfolios from growth-seeking to matching assets.
Over the three-year period, we have seen evidence of schemes investing in more matching assets. We have also considered how discount rates may have changed as a result of changes in expected returns on return-seeking assets since the previous scheme valuation, and have seen a variety of views. For the purposes of this analysis, liabilities are calculated using discount rates that have a lower margin over gilt yields than they had at a scheme’s last valuation date (reflecting lower expected return on assets and likely changes to strategic investment strategies). This results in a negative item in Figure 5a for ‘change in relative expected outperformance’ for 31 December 2021 and 31 March 2022.
In practice, schemes may use different approaches to setting discount rates and may also have different views now on prudent expected returns from the same portfolio than they had at the previous valuation.
When rolling forward valuations, we have historically attempted to estimate how the “typical” mortality assumption will change from tranche to tranche (and over the three-year valuation cycle). There are a variety of opinions over how to interpret excess deaths from COVID-19, and the weighting to apply to data for years 2020 and 2021 in respect of the CMI future improvement model can now be chosen by trustees as part of the valuation assumptions. We have made allowance for reducing life expectancies in line with the proposals discussed in the January CMI working paper 168. This serves to further reduce liabilities and improve aggregate funding levels.
For the purpose of this analysis, to estimate the level of hedging we use PV01 and IE01 data, provided along with a scheme’s asset data. If these aren’t available, we make an assumption based on the scheme’s asset portfolio as to the extent of interest rate and inflation hedging.
The method used to estimate the movement in the deficits over the three-year periods presented below is necessarily simplistic. We expect scheme actuaries to have access to more detailed scheme data, which will allow a more in-depth reconciliation to take place. The method and simplifications we have made in these reconciliations are contained in the methods, principal assumptions and limitations section.
In Figures 5a and 5b, the figures are given in £billion. The size of the bars shown on the chart illustrates the relative impact of each source of change on the deficit over the period.
Figure 5a: Estimated impact of market conditions on deficits of all Tranche 18 schemes – December 2019 to December 2022
Sources: TPR, Refinitiv
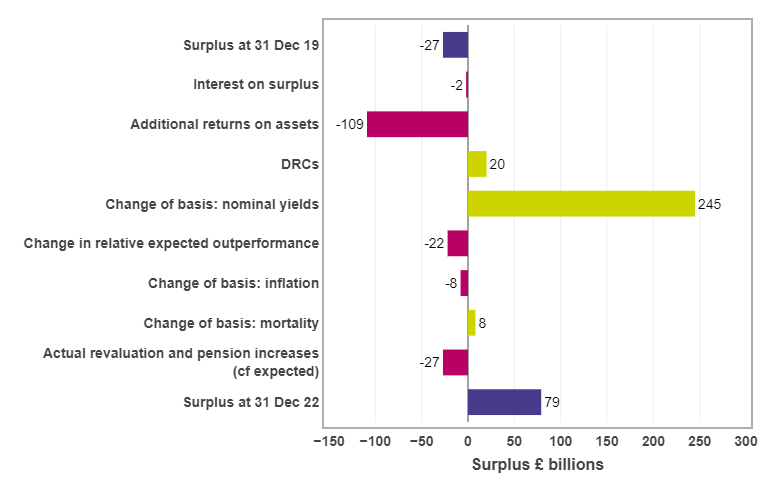
We estimate that, on a TPs basis, there is an aggregate surplus across T18 schemes as at 31 December 2022. This is primarily because the large change in nominal yields over the period (which reduces liabilities). along with DRCs that have been paid, have been greater than the offsetting effect of the negative return on scheme assets and a reduction in the relative outperformance to gilts used in calculating the liabilities. The impact from hedging is shown in the additional return on assets item and not the change of basis: notional yields or change of basis: inflation items. Other items also affected the change in the aggregate funding level, such as lowering life expectancies and the effect of higher than anticipated inflation over the period.
Figure 5b: Estimated impact of market conditions on deficits of all Tranche 18 schemes – March 2020 to March 2023
Sources: TPR, Refinitiv
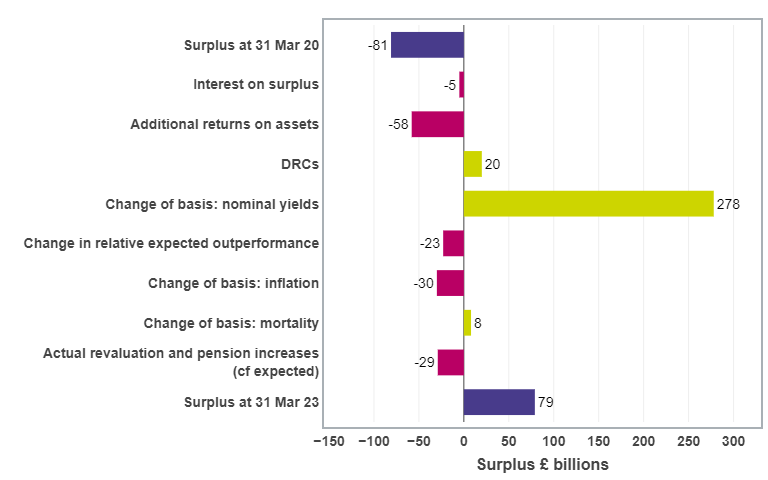
We estimate that the funding position of T18 schemes as at 31 March 2023 would have improved from three years ago. As with the 31 December 2022 position, this is mainly due to the large change in nominal yields over the period. Other items are also broadly similar to those shown in the 31 December 2022 reconciliation.
In Figure 6, we have shown the proportion of T18 schemes we expect to be in deficit or surplus on a TPs basis as at 31 March 2023, compared to the position at the previous valuation date.
Figure 6: Estimated number of Tranche 18 schemes in deficit / surplus at previous valuation and March 2023
Sources: TPR, Refinitiv
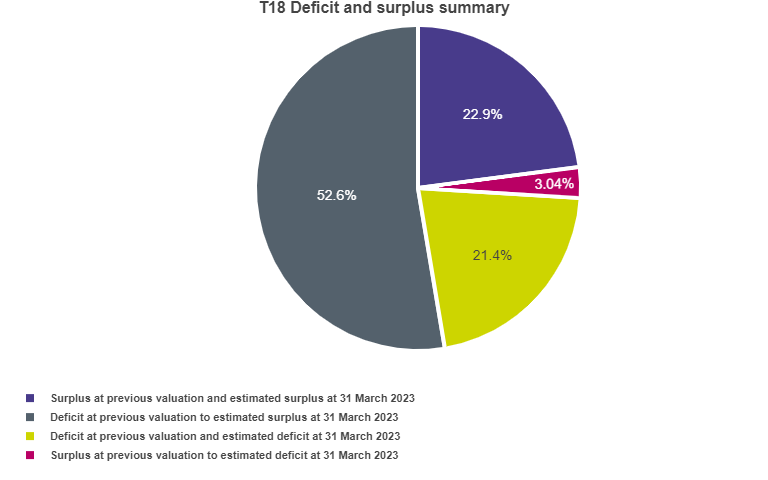
We estimate that 76% of schemes are in surplus on a TPs basis at 31 March 2023. The method and simplifications we have made in this analysis are contained in the methods, principal assumptions and limitations section.
Variation of impact on scheme deficits – all schemes
The landscape level analysis and trends will not be representative of the impact of market conditions on individual schemes. Different schemes will have had different experiences depending on their individual investment strategies and funding plans.
We have illustrated this variation in Figures 7a and 7b. These illustrations estimate how the funding level of each scheme has changed over the three-year period to 31 December 2022 (Figure 7a) and to 31 March 2023 (Figure 7b) for all DB schemes (ie not just T18). Note that these illustrations show changes in funding levels and not the funding levels themselves.
During the first quarter of 2020, most asset classes fell substantially in value, with most of the fall coming in the second half of March 2020 due to COVID-19. This included falls in the value of bonds and gilts, and consequently the yield on gilts has risen. We therefore expect aggregate funding levels as at 31 March 2023 to have increased proportionally more than those at 31 December 2022 given the lower overall funding level starting point for March 2020 valuations.
Figure 7a: Variation of impact of market conditions on deficits of all schemes – December 2019 to December 2022
Sources: TPR, Refinitiv
The average funding level at 31 December 2022 was higher compared to three years earlier (by around 18%), as has shown in Figures 4 and 5a. However, the experience of individual schemes varied significantly. Five per cent of schemes saw estimated funding levels fall by 2%, whereas 5% of schemes saw estimated funding levels rise by more than 55% over the three-year period.
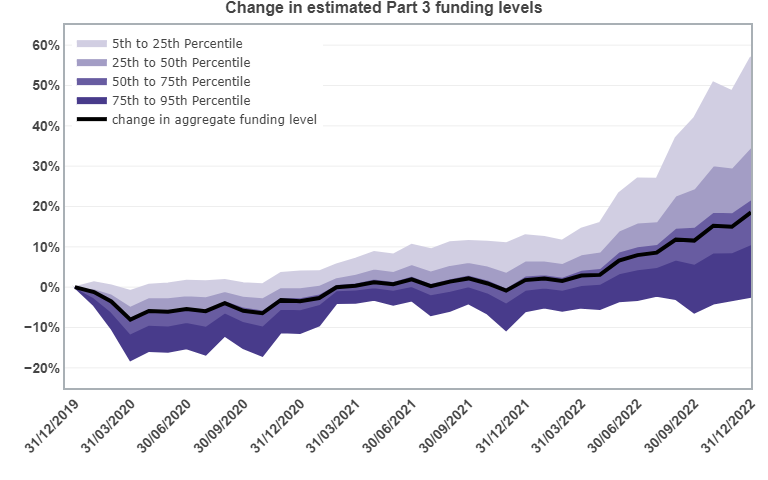
Figure 7b: Variation of impact of market conditions on deficits of all schemes – March 2020 to March 2023
Sources: TPR, Refinitiv
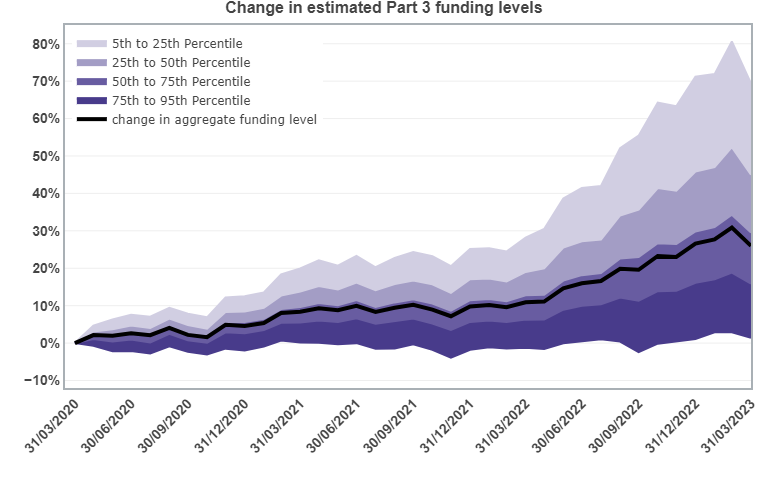
Over the three-year period to 31 March 2023, the average funding level was higher compared to three years earlier (by around 25%), as shown in Figures 4 and 5b. However, the experience of individual schemes has varied significantly, but for the vast majority of schemes was positive. Five per cent of schemes saw estimated funding levels fall by more than 1%, whereas 5% of schemes saw estimated funding levels rise by more than 69% over the three-year period.
The most significant factors driving the variation of experience between schemes are the extent to which schemes hedge interest and inflation rates, and the extent to which schemes are invested in growth asset classes (eg equity and property). Schemes that had not hedged interest rate risks have improved funding levels (in some case by substantial amounts), while fully hedged schemes remain broadly the same.
Implications for scheme funding
The analysis in this report shows that many schemes with valuations as at December 2022 and March 2023 will at the very least have a smaller deficit than those revealed at their previous valuation date, or would likely be in surplus.
Economic conditions will also have impacted the extent to which some employers can afford to make DRC payments. For some employers, affordability will have significantly reduced, at least in the short term.
Therefore, we recognise some trustees will need to make changes to their TPs and recovery plans to reflect changes in the strength of the employer covenant, the scheme’s funding level and changes in the extent to which employers can afford to make DRC payments.
Potential impact on DRCs – scheme funding levels
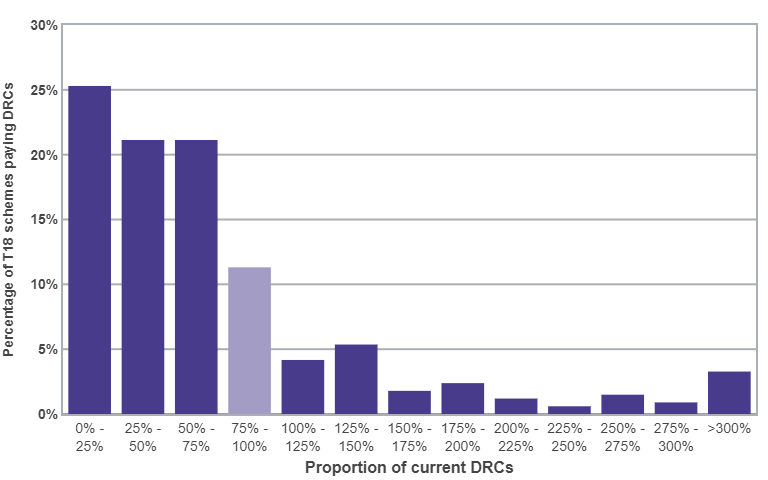
Figure 8a illustrates the potential impact on DRCs for T18 valuations with a 31 March 2023 valuation date. The impact is expressed as a percentage of the level of current DRCs (ie what was agreed in T15 valuations). We have assumed, for the purpose of illustration and to remove the distorting impact of short remaining periods, that each scheme aims to eliminate the deficit over three years, or the remaining term of the recovery plan agreed at the last valuation, whichever is longer.
Figure 8a: Modelled Tranche 18 DRCs as a proportion of current DRCs – based on same RP end date as last valuation, or three years if longer
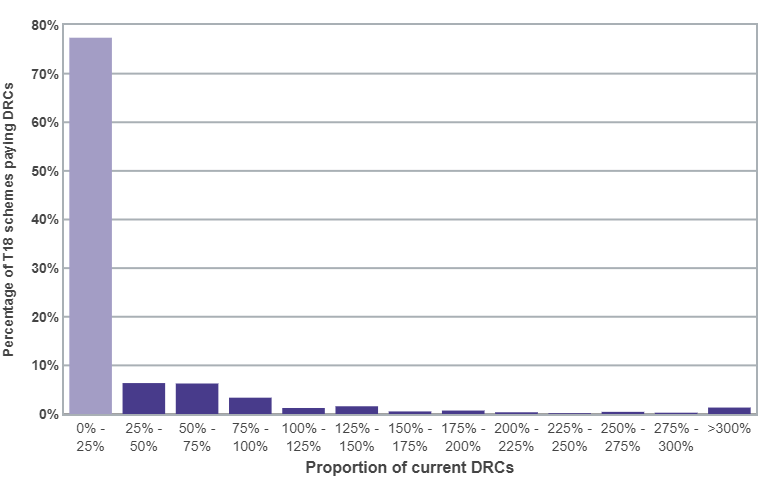
When a scheme moves from deficit into surplus, they are included in Figure 8a with a 0% proportion of current DRCs. As a lot of schemes have moved from a deficit position at the previous valuation to showing a surplus as at 31 March 2023 (around 69%, see Figure 6), including them in the chart does not give a representative picture of the DRCs we expect to be paid for those schemes still in deficit. We have therefore removed them from Figure 8b.
Figure 8b: Modelled Tranche 18 DRCs as a proportion of current DRCs — based on same RP end date as last valuation, or three years if longer (excludes schemes now expected to be in surplus)
On these assumptions, around 79% of T18 schemes in deficit would be able to retain their DRCs at the same level or reduce them if their valuation date was 31 March 2023. 21% of schemes would need to increase DRCs. Around 3% of schemes in deficit (less than 1% of all DB schemes) would need to increase DRCs to more than three times their current levels. In these cases, a relatively small increase in the recovery plan length would lead to a much lower increase in the level of DRCs required.
This analysis does not take into account whether the TPs represent the current strength of the employer covenant, whether the current level of DRCs remain affordable, or what level of contributions is affordable.
Potential impact on DRCs – employer affordability
A key factor for trustees and employers when agreeing an appropriate recovery plan is the affordability position of the employer, recognising that what is affordable may be affected by the employers’ plans for sustainable growth. Economic conditions may have impacted the extent to which individual employers can afford to make DRC payments. For some employers, affordability will have been significantly reduced and will be the limiting factor for DRCs, at least in the short term.
Methods, principal assumptions and limitations
Scheme data
We rely solely on the information supplied to us via scheme returns, which may not be completely up-to-date or contain the level of detail that would be available to scheme actuaries when advising trustees. This inevitably leads to many more simplifications and approximations in the methods we use to estimate aggregate and individual funding positions, compared with the more robust calculations carried out for formal valuation and recovery plan reporting by scheme trustees. Additionally, the more market conditions have moved during the period, the less reliable these projection methods will be.
Many of these assumptions or simplifications have been driven by data limitations. For example, we have used index tracking of major asset classes, and made only limited allowance for changes in asset strategy since the previous valuation based on approximate rebalancing assumptions. Where schemes have supplied PV01 figures, we have used this in updating asset values. Where schemes have provided negative cash proportions, we have used this to determine approximate hedging ratios and periodically rebalanced asset portfolios at regular intervals to maintain this ratio. We have made no assumption on top of this, for example relating to pooled LDI investments.
Additionally, we have made assumptions about scheme liabilities in aggregate that may not accurately reflect the underlying liabilities of individual schemes.
The baseline for estimating the current deficit of each scheme is based on the results reported to us following its last valuation, adjusted approximately for contributions paid and movements in assets and liabilities in line with appropriate indices. Our analysis relies upon point-in-time valuations of schemes’ assets and liabilities. We have not allowed for any changes to the TPs to reflect any covenant changes since the last valuation.
As in previous years, we have seen evidence of schemes investing in more matching assets. We have also considered how discount rates may have changed as a result of changes in expected returns on return-seeking assets since the previous scheme valuation, and have seen a variety of views. For the purposes of this analysis, we have reduced the discount rate premium compared to the previous valuation. We also acknowledge that schemes may use other methods to derive their discount rate, such as by reference to inflation, but we have not allowed for this in our analysis.
We made an allowance last year for the alignment of RPI to CPIH from 2030. This was based on the average maturity of DB schemes and the expectation that the current RPI curve factors in the change from 2030. The allowance made last year was sufficient to cover this year, but we will revisit this in future years.
We have not attempted to quantify the potential impact of COVID-19 on schemes’ mortality experience. We have however reduced our life expectancy assumption in line with the proposals discussed in the January CMI working paper 168.
When estimating the impacts on RPs, we have used the simplifying assumption that all T18 schemes have their next actuarial valuation as at 31 March 2023.
The assumptions we have made may be a significant source of difference when compared with formal valuation results at an individual scheme level. In particular, for individual schemes the results will be highly dependent on the following:
- The exact date of valuation.
- The scheme’s asset strategy, including any changes made during the inter-valuation period.
- The extent of hedging against interest rates and inflation.
- Any changes to its mortality and longevity assumptions to reflect new information and emerging experience.
- The scheme’s assessment of the appropriate discount rate and inflation assumption used to measure its liabilities.
For example, if trustees choose to use discount rates that are higher than we have assumed, then the estimated liabilities and deficits are likely to be lower than those modelled in this analysis, and vice versa.
The information on DRCs we collect covers DRCs expected in each year of the associated recovery plan, with additional information as to the date the plan started and ends. DRCs are assumed to be paid continuously: 1/365th of DRCs in year one of the plan are assumed to be paid on every day of the year.
As previously noted, we hold a limited data set in relation to DB schemes. With the significant movements in gilt yields since early 2022 and in particular the LDI impacts in late 2022, both of which have contributed to a significant impact on the movement of DB funding, this year’s analysis output is likely to have more uncertainty attached to it given the limitations of our data (both in it’s scope and timeliness). As we get more up to date information from schemes when they start to submit their more recent valuations and update their positions via the DB scheme returns, we will assess the impact and how this compares to our earlier estimates we have presented in this publication. We are continually reviewing what level of data (and frequency) is required in order to give us the best possible view of the risk landscape, but in the most proportionate way.
Employer covenant
The strength of the employer covenant is an important element in scheme funding and a key part of integrated risk management. We use a number of metrics relating to employers to determine covenant support. However, we recognise that this is a highly complex area and that a one-size-fits-all approach to looking at employer covenant would miss the many complexities and nuances of individual employers. For these reasons, we combine the use of metrics with professional judgement when assessing covenant.
Assessing the covenant is about understanding the extent to which the employer can support the scheme, now and in the future, including the risks to this support being available when it is needed. The focus should be on the ability of the employer to make cash contributions to the scheme to achieve and maintain full funding over an appropriate period, including addressing downside risks.
Recent economic conditions have resulted in considerable uncertainty over some employers' covenant strength and their affordability to address deficits in schemes. However, the impact will be varied across the landscape and some businesses will recover more quickly than others.
Glossary
Deficit repair contributions (DRCs)
These are contributions made by employers to the scheme in order to address any deficit in the value of the assets compared to the technical provisions (TPs), typically in line with the Schedule of Contributions and the recovery plan (RP). For the purpose of this analysis, we have assumed current contributions to be those in year four of the RP agreed at the Tranche 15 valuation, except for RPs which were shorter than four years where we have assumed that the contributions paid in the last full year of the plan have continued. Throughout this analysis we have used DRCs in the context of the value the scheme receives without making any allowance for any tax benefit the sponsoring employer may receive.
Asset IE01 figures
IE01 is the £ change in value of assets for a 0.01% increase in inflation rates across the whole curve.
Integrated risk management (IRM)
IRM is a risk management approach that can help to identify, manage and monitor the factors that affect the prospects of meeting schemes’ funding objectives. It involves examining how employer covenant, investment and funding risks relate to and are affected by each other. It also considers what to do if risks materialise.
Asset PV01 figures
PV01 is the £ change in value of assets for a 0.01% increase in interest rates across the whole curve.
Recovery plan
Under Part 3 of the Pensions Act 2004, where there is a funding shortfall at the effective date of the actuarial valuation, the trustees must prepare a plan to achieve full funding in relation to the TPs. The plan to address this shortfall is known as a recovery plan.
Recovery plan length
The recovery plan length is the time that it is assumed it will take for a scheme to eliminate any shortfall at the effective date of the actuarial valuation, so that by the end of the RP it will be fully funded in relation to the TPs.
Technical provisions (TPs)
The funding measure used for the purposes of Part 3 valuations. The TPs are a calculation, undertaken by the actuary, of the assets needed at any particular time to make provision for benefits already accrued under the scheme, and required for the scheme to meet the statutory funding objective, using assumptions prudently chosen by the trustees. These include pensions in payment (including those payable to survivors of former members) and benefits accrued by other members and beneficiaries, which will become payable in the future.
Tranches
‘Tranche’ refers to the set of schemes that are required to carry out a funding valuation within a particular time period. Schemes whose valuation dates fall between 22 September 2022 and 21 September 2023 (both dates inclusive) are in Tranche 18. Because scheme-specific funding valuations are generally obtained every three years, these schemes (with a few exceptions) had their last formal valuation in Tranche 15 (valuation dates between 22 September 2019 and 21 September 2020).