Annual Funding Statement analysis 2026
Scheme funding analysis of the defined benefit (DB) pension schemes universe as at 31 December 2025.
Published: 6 May 2026
Introduction
This scheme funding analysis sets out the results and analysis of our modelling of the occupational defined benefit (DB) universe as at 31 December 2025 based on a technical provisions (TPs) (Part 3) funding basis.
We calculated these figures by adjusting schemes’ latest actuarial valuations to the same date. We used scheme data provided to us through the scheme return or Submit a Scheme Valuation, combined with relevant financial market information and actuarial assumptions.
Our calculations use broad assumptions and approximations combined with general actuarial methods and techniques. This is due to the high level and limited data that we hold. We cannot take account of all scheme-specific characteristics, and the actual position of individual schemes will vary. A scheme’s individual funding position will depend on a number of factors not covered in our data or methodology. In particular, actual investment returns, levels of hedging applied over the inter-valuation period and asset sales to meet any required benefit and collateral payments will be scheme-specific and likely to differ from those assumed by our modelling. Nevertheless, we believe these industry-level figures provide a useful overall picture of the aggregate position.
The figures in this report are based on the latest version of our internal model, so that the results presented here will enable consistent comparisons with other external organisations that also publish occupational DB asset and liability values. This model adopts a different methodology to historical models so these figures cannot be directly compared to figures we have historically published.
This material and the work to prepare it comply with the Financial Reporting Council’s Technical Actuarial Standard 100. The users of this material are anticipated to be the trustees of the DB schemes we regulate, the employers that support those schemes, and their advisers. We assume these users are familiar with occupational DB scheme funding terminology.
Summary
The significant changes in scheme asset strategies seen over the last 20 years towards de-risking have continued at pace, especially as most schemes have moved into surplus on a TPs basis and, for a majority of schemes, surplus on a low dependency and buy-out basis as well. The majority of scheme assets are now invested in bonds, including leveraged LDI investment strategies, and an increasing number of liabilities are fully insured with annuities, either within the scheme as a buy-in or externally as a result of schemes fully buying out. The latter has caused the DB scheme universe to shrink further in size.
The most important factor that impacts the value of scheme assets and liabilities is the movement in gilt yields. We have observed a moderate increase in gilt yields, which has contributed to a fall in asset and liability values over the three-year period from 31 December 2022 to 31 December 2025. Additionally, over the period 31 December 2025 to 31 March 2026 we have seen a further increase in conventional gilt yields, although real yields are less affected, particularly at the long end, given we have also observed a similar increase in inflation expectations.
The increase in gilt yields have caused a reduction in the value of scheme liabilities and asset values over the three-year period, with the value of liabilities falling by more than the assets. This has resulted in an increase in the overall universe aggregate funding levels, with an estimated 88% of schemes now expected to be in surplus on a TPs basis. We have also observed a reduction in the number of schemes over the three-year period, which has primarily been driven by the number of schemes who have undertaken a bulk transfer to an insurer over this period.
The results of the DB universe funding position as at 31 December 2025 on a TPs basis are shown in tables 1 and 2:
Table 1: Funding position on a TPs basis
Sources: TPR (scheme data), London Stock Exchange Group (LSEG), Bank of England (BoE)
| Funding position on a TPs basis | 31 December 2022 (Note 1) | 31 December 2025 |
|---|---|---|
| Assets (£billions) | 1,234 | 1,140 |
| TPs (£billions) | 1,053 | 922 |
| Surplus/(Deficit) (£billions) | 181 | 218 |
| Funding level | 117% | 124% |
| % of schemes in surplus | 73% | 88% |
| % of schemes in deficit | 27% | 12% |
| Number of schemes (Note 2) | 4,927 | 4,548 |
Notes for Table 1:
- [1] Figures for 31 December 2022 have been estimated using the data on our system as at 30 September 2023
- [2] Where a scheme is sectionalised or segregated, each section is treated as if it were a separate scheme for the purposes of this report.
Table 2: Scheme distribution on a TPs basis as at 31 December 2025
Sources: TPR (scheme data), LSEG, BoE
| Funding level | Number of schemes | Total assets (£billions) | Total TPs liabilities (£billions) | Surplus/ deficit (£billions) |
|---|---|---|---|---|
| Under 80% | 110 | 7 | 10 | -3 |
| 80% to 100% | 436 | 92 | 95 | -4 |
| 100% to 120% | 1,713 | 404 | 371 | 33 |
| Over 120% | 2,289 | 637 | 446 | 191 |
| Total | 4,548 | 1,140 | 922 | 218 |
Figure 1: Percentage of schemes by funding level – December 2022 to December 2025
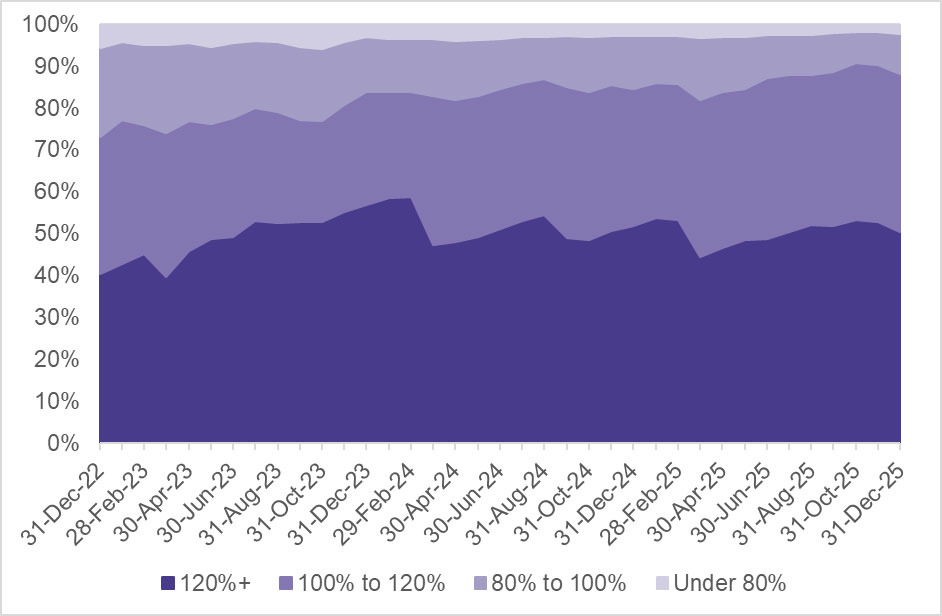
The chart above shows the percentage of schemes by funding level band on TPs. We expect that the aggregate funding position as at 31 March 2026 (and 5 April 2026) will have fallen slightly compared to that at the end of December 2025, with a corresponding reduction in the aggregate surplus over this period.
Market indicators
Market summary
Over the period 31 December 2022 to 31 December 2025, yields on UK conventional and index-linked gilts remained materially higher than in the preceding period.
While not smooth, the period was marked by a general rise in yields on both UK conventional and index-linked gilts, with the 20-year spot yield for both conventional and index-linked gilt yields increasing by around 1.0% to 1.5% p.a. over the period. The increase in gilt yields continued a trend of rising interest rates observed since 2021.
Over the period, the Bank of England (BoE) initially continued raising interest rates as it had been since late 2021, with the base rate reaching a high of 5.25% in August 2023, before gradually beginning to reduce rates from August 2024, ending the period with the base rate at 3.75%.
Credit spreads tightened over the period as a result of macro-economic conditions, primarily inflationary pressures beginning to moderate and economic growth proving resilient, together with institutional demand from insurers and pension schemes. Therefore, credit markets outperformed the equivalent government bond indices over the three-year period to 31 December 2025.
Equity markets have generated positive returns over the three-year period to 31 December 2025. Performance has continued to be dominated by the US market and in particular, the technology sector, which has been driven by enthusiasm surrounding artificial intelligence and its applications. This trend has been particularly marked during 2025.
Bond yields
Figure 2 shows the BoE estimates of conventional and real gilt yields and implied inflation as measured by the RPI at a 20-year duration at each date from 31 December 2022 to 31 December 2025.
Figure 3 shows the real forward interest rates as estimated by the BoE as at the end of December 2022 and December 2025.
Figure 2: Benchmark yields
Sources: BoE, LSEG
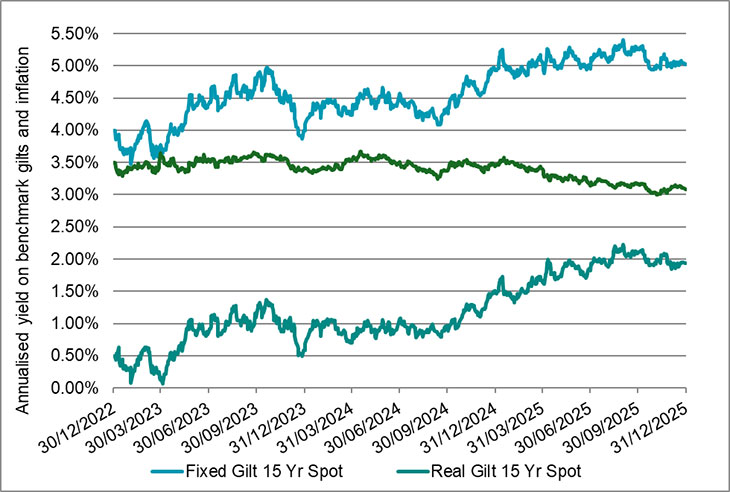
Long-dated conventional and index-linked gilt yields rose fairly steadily over the three-year period, with nominal yields moving from c. 4.0% to c. 5.0% and real yields from c. 0.5% to c. 2.0%. Long-term market-implied inflation has fallen slightly over the period and has remained broadly in the range 3.0% p.a. to 3.5% p.a. over the three-year period, gradually falling to the lower end of this range during 2025.
Figure 3: UK instantaneous real forward gilt curves
Source: BoE
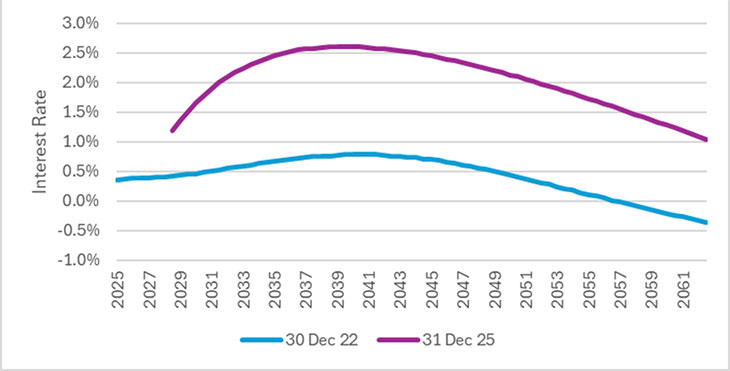
Real forward rates are higher for all maturities at 31 December 2025 than they were at 31 December 2022. The difference is most marked for maturities around 2040, with more of a marked upward shape to the curve for shorter maturities. The peak of the curve is at a shorter maturity than had been the case in 2022.
Asset returns
Figure 4 and Table 3 both show the total investment return for a range of asset class indices since the end of 2022 up to the end of 2025. The investment returns in figure 3 have been re-based to 100 at 31 December 2022, therefore the chart shows the relative change from that point.
Figure 4: Asset returns
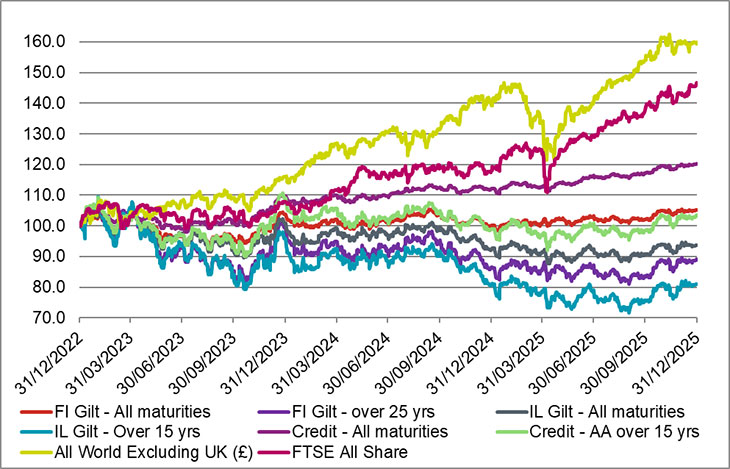
The graph corresponds with the market summary, whereby gilts (and corporate bonds) have seen low returns over the three-year period, particularly so at longer maturities where returns have been negative. Index-linked gilts have also observed negative returns over the three-year period, of between 10% and 20% cumulative, with falling long-term inflation expectations being an additional headwind versus conventional gilts. Corporate bonds observed higher returns than those of gilts, seeing cumulative positive returns of up to 20%, partly due to the shorter duration, and partly due to narrowing spreads. Equities observed positive returns over the three-year period, with cumulative returns of between 45% and 60%.
The actual returns for the different asset indices (as shown in the previous graph) are set out in table 3.
Table 3: Total returns in UK Sterling from different asset classes over the three years to 31 December 2025
| Index name (asset class) | Total returns over the period 31 December 2022 to 31 December 2025 |
|---|---|
| FTSE British Government Fixed All maturities (conventional gilts) | 5% |
| FTSE British Government Fixed over 25 years (conventional gilts) | -11% |
| FTSE British Government Index Link All maturities (index-linked gilts) | -6% |
| FTSE British Government Index Link over 15 years (index-linked gilts) | -19% |
| Iboxx UK Sterling Corporate Bond All Maturities (corporate bonds) | 20% |
| Iboxx UK Sterling Corporate Bond over 15 years (corporate bonds) | 3% |
| FTSE All World Excluding UK Sterling (overseas equities) | 59% |
| FTSE All Share (UK equities) | 47% |
DB schemes
Funding position of DB schemes in aggregate
Figure 5 shows our estimates of aggregate assets and liabilities (TPs) for all schemes in our regulated DB universe over the three-year period ending 31 December 2025.
Figure 5: Estimated assets and liability positions of occupational UK DB pension schemes
Sources: TPR (scheme data), BoE, LSEG
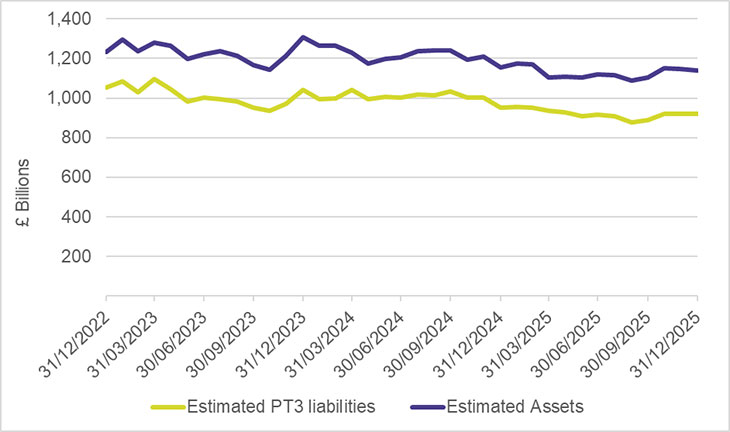
The graph shows how both asset values and liability values remained broadly stable during the period from 31 December 2022 to 30 June 2024, and then fell slightly (liabilities decreasing in value by around 10% and assets by around 5%). As liability values fell by more than corresponding asset values, this would be expected to result in an increase in overall surplus.
The two most significant reasons for the reductions in asset and liability values are an increase in yields on government and corporate bonds over the three-year period (although not to the same extent as was seen during 2022) and a trend towards schemes completing buy-out with insurers. There has been an increase in the number of schemes that have completed the buy-out process over the last few years. An estimated £135 billion of pension scheme liabilities have been insured with the purchase of annuities (whether as part of the scheme assets, through buy-in, or as a full buy-out) during this three-year period (Source: Hymans Robertson Risk Transfer Report, January 2026).
Figure 6 estimates the key factors that have caused the change in the aggregate surplus over the three-year period.
Figure 6: Estimated impact of change in surplus over the period December 2022 to December 2025
Sources: TPR, LSEG, Office for National Statistics (ONS)
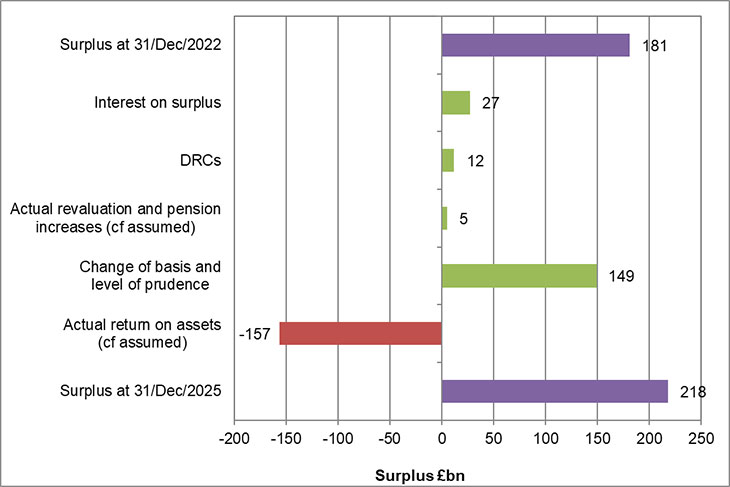
The graph shows that the change in the value of the surplus (an increase of approximately £40 million) is principally influenced by the interest on the surplus that would be expected due to the expected return on the scheme assets and liabilities being three years closer to payment, along with contributions paid into the scheme by employers. The actual return on the assets was lower than had been assumed, but the expected future return has increased, both of which are due to an increase in government bond yields over the three years to December 2025; however, their effects are offset by the significant de-risking of scheme investments.
For schemes that have bought out with an insurer over the period, these will, of themselves, not consistently cause an increase or decrease in aggregate surplus, as this will depend on a number of factors. These include the extent that the TPs basis converges with the cost of buy-out and whether further funding is required by the employer to achieve buy-out. While the majority of schemes were in surplus on a TPs basis over the period, which all else being equal, would be expected to be a headwind in the overall surplus figure, given the time it takes to convert buy-ins to buy-outs, a significant number of the initial buy-in transactions may have occurred prior to 2023, before these surpluses arose.
The analysis above is meant to show the approximate drivers of change for the universe as a whole. Therefore, it will likely not be representative of the impact of market conditions on individual schemes. Different schemes will have had different experiences, in particular depending on their individual investment strategies and funding plans. Schemes that were relatively unhedged in respect of interest rate and inflation risks are likely to have experienced more significant improvements in funding levels compared to well-hedged schemes, as liabilities fell more significantly than assets.
The overall improvement in funding on a TPs basis was also observed for alternative funding bases, with material improvements in funding positions over the last three years on a low dependency basis and buy-out basis, as set out in table 4.
Table 4: Funding position on a low dependency and buyout basis
Sources: TPR (scheme data), LSEG, BoE
| 31 December 2025 | 31 December 2025 | |
|---|---|---|
| Funding basis | Low dependency | Buy-out |
| Assets (£billions) | 1,140 | 1,140 |
| Liabilities (£billions) | 977 | 1,044 |
| Surplus/(Deficit) | 163 | 95 |
| Funding level | 117% | 109% |
| % of schemes in surplus | 82% | 62% |
| % of schemes in deficit | 18% | 38% |
| Number of schemes (Note 3) | 4,548 | 4,548 |
Note for Table 4
[3] Where a scheme is sectionalised or segregated, each section is treated as if it were a separate scheme for the purposes of this report.
Our estimates show that as at the end of December 2025, we estimate that over 80% of the DB universe was in surplus on a low dependency basis and over 60% of schemes in surplus on a buy-out basis, with an aggregate surplus of circa £160 billion and £90 billion respectively.
We note there are a range of potential approaches and assumptions that can be applied when determining a low dependency funding basis, dependent on a range of factors, including investment strategy, level of prudence applied and the size of the scheme. For our analysis of the DB universe on a low dependency basis, we have applied a uniform approach, and have assumed that low dependency liabilities are calculated using a discount rate of gilts plus 50 basis points, with no allowance for any inflation risk premium. In practice, we expect that we will observe a range of approaches to determining low dependency, which we will monitor and consider changes to our modelling approach over time.
Fast Track
Tranche 25/26 is the second valuation tranche to undertake a valuation under the new funding and investment regulations and revised DB funding code of practice applicable for valuations with effective dates on or after 22 September 2024.
Our analysis indicates that if all the schemes in the DB universe were to undertake a valuation as at 31 December 2025, more than 90% of schemes would potentially be able to meet all the Fast Track parameters, without the need to make any change to the level of their deficit repair contributions (DRCs). For some of these schemes, this might require a change in the existing funding approach, but this could be done at no additional current cost to the employer.
For further information, see the Fast Track submissions tests and conditions.
Changes in financial conditions over the period 31 December 2025 to 31 March 2026
Principally due to the Iran war, financial market conditions were more volatile in early 2026, specifically during March, than during much of the preceding year. Over the first quarter of 2026, we have observed increases in gilt yields, an increase in inflation expectations, a widening of credit spreads and a relatively low return on equities following a strong run. Given the movement in financial markets, we expect that the overall values of TPs and assets are lower at 31 March 2026 (or 5 April 2026) than they were at the end of 2025, with a relatively small reduction in funding levels and aggregate surplus. Although we anticipate a small reduction in funding during this period, overall funding of the occupational DB pension sector remains relatively healthy.
Methods, principal assumptions and limitations
Scheme data
We have used the scheme funding data on our system as at 31 December 2025 to produce our summary of estimates as at that date. This data comes from the 2025 annual scheme return and Submit a Scheme Valuation submissions received by that date. For historic figures in this analysis, we estimated them using scheme funding data held on our systems as at 30 September 2024, 31 March 2024 and 30 September 2023, where applicable.
The raw data and model outputs have been subject to actuarial data checks which look to highlight key outliers and are adjusted as necessary.
We have also used external data sources, including:
- financial market indices data obtained from LSEG
- ONS for values of annual benefit outgo and contributions in respect of future accrual
It’s important to note the following.
- The underlying data is historical. Schemes have up to 15 months to complete a valuation and need to only undertake a valuation every three years. Therefore, the liability and asset values held are generally between one and four years out of date.
- The data is a high-level summary of the results of the valuation, ie we do not have individual member data or detailed benefit structure information that schemes have access to.
- The asset breakdown is based on the last audited accounts over the scheme return year. Schemes have up to seven months from the year end to complete their audited accounts. Therefore, the asset breakdown is generally around two years out of date.
- When referring to 'schemes' in this report, this is in fact referring to individual segregated sections of assets and liabilities. For example, the data for this modelling includes 4,548 sections as at December 2025. This report describes these as 'schemes' for simplicity, in line with common use. It should be noted that some of these 'schemes' are sub-sections of a single scheme, so the number of schemes (if defined as separate trusts) is less than this.
Modelling methodology
The figures in this report are based on our modelling of the DB universe. This estimates the aggregate assets and liabilities up to 31 December 2025 by rolling forward from schemes’ latest actuarial valuations, based on scheme data and relevant financial market information. Given the purpose of the model, there is no explicit additional prudence applied (on top of the prudence allowed for in the TPs for each scheme at the previous valuation); rather the aim is for the results to be our best-estimate of an up to date position of the DB universe as a whole in the absence of any other available data.
Given the high level and limited data that we hold, our calculations use broad assumptions and approximations combined with general actuarial methods and techniques. We cannot take account of all scheme-specific characteristics, and the actual position of individual schemes will vary depending on a number of individual factors not covered in our data or methodology. The broad assumptions we apply are based on judgement. We are aware there are alternative assumptions/approaches that could be adopted. These might be equally valid and would lead to slightly different results. We continue to review our approach and the assumptions underlying our model on an ongoing basis.
The key assumptions, which are judgement based, underlying our model include the following:
- TPs are estimated assuming each scheme uses a ‘gilts +’ type approach.
- Low dependency liabilities are estimated for each scheme by taking the TPs results and assumptions reported to us following a schemes last valuation, adjusted to a basis that assumes: a discount rate broadly equivalent to the gilt curve plus 0.5% p.a., a Retail Price Index inflation assumption with no adjustment for an inflation risk premium, a Consumer Price Index (CPI) inflation assumption which assumes a 0.3% p.a. deduction to our RPI assumption (as a broad approximation of all future pricing differentials for the difference between RPI and CPI) and a broad expense allowance of 3% of liabilities.
- Liability values are adjusted for movements in both conventional and index-linked gilt markets to take account of market changes when deriving discount rates and inflation between the date of the last valuation and the calculation date.
- Our estimate of TPs, also make a further adjustment by reducing the overall discount rate over time to allow for the impact of schemes’ maturing and de-risking along a journey plan. The impact of allowing for a more prudent overall discount rate is to increase the value of the liabilities compared to no adjustment being applied. An adjustment is applied for all schemes except in the situation where schemes at their last valuation adopted discount rates in line with a low dependency style basis. In that case, no further adjustment is applied. Where an adjustment is applied, it is smaller for open schemes than it is for other schemes.
- For schemes that have a mortality assumption that shows their assumed life expectancies are within the bottom quartile, our estimate of the low dependency liabilities is adjusted to assume a stronger mortality assumption equal to the 25th percentile life expectancy from our universe data.
- Our estimate of buy-out liabilities is further adjusted to reflect broad changes in insurer pricing over time.
- Further broad adjustments are made to liabilities for changes in longevity expectations by adjusting the liabilities in line with changes to the core CMI model over the period since a scheme's last valuation.
- Other than the general assumption of an overall increase to the level of prudence applied as described above, trustees are assumed not to take any management action in regards of buying and selling assets or changes to the investment allocation over time.
- Both assets and liabilities are adjusted in line for expected benefit payments paid combined with an adjustment for future accrual, where applicable, over the period since a scheme's last valuation.
- Assets are further adjusted in line with movements in market indices plus DRCs over the period since a scheme's last valuation.
- Assets are rebalanced daily in order to retain the same investment allocation.
There are many more simplifications and approximations in the methods we use to estimate aggregate and individual funding positions compared with the more robust calculations carried out for formal valuation and recovery plan reporting by scheme actuaries for trustees. Additionally, the greater the magnitude of change in market conditions, the less reliable the simplified method and data will be in illustrating the impact of changing funding levels over time. It should be noted that this is not a TPR-specific issue, but a global actuarial issue when using the approximate roll-forward methodology to estimate assets and liabilities at alternative dates.
Results are always approximate. While we do not expect a pronounced systemic bias in the model, results may be materially inaccurate at an individual scheme level where experience differs to those of our key assumptions. This could be because of either or both of the following:
- Trustees taking positive management action to change investment strategies, which are not reflected in our current data set due to time lag issues.
- Actual asset returns are materially different to index returns or scheme experience materially differs from that assumed.
Caveats and limitations of advice
We are content that the data used in the model is appropriate to provide high-level estimates of the DB scheme universe as at 31 December 2025. As the scope of the model is to provide estimates at an aggregate level, the results should not be used to draw conclusions for individual schemes, nor provide any analysis for individual scheme funding levels. Considering the purpose of these results, we do not consider it appropriate to provide further analysis on the material risks and uncertainties. By necessity these risks will be at a scheme specific level, based on the characteristics of the funding and investment approach of each scheme. Therefore, it will require the scheme actuary or corporate actuary to provide the necessary advice.
Compliance
This note complies with Technical Actuarial Standard 100 (TAS 100) v2.0, as published by the Financial Reporting Council. TAS 100 v2.0 applies to technical actuarial work (as defined in section 4 of TAS 100 v2.0) that is completed on or after 1 July 2023.