DC consolidation and economies of scale: emerging evidence
Pension schemes play a critical role in delivering good outcomes for savers, and we expect them to offer good value to their members. The UK pensions market is continuing to consolidate and scale. This shift brings important opportunities. Scale can support stronger governance, enhanced investment capability and improved member outcomes. At the same time, it raises expectations around resilience, operational sophistication and the effective stewardship of members’ savings.
This report brings together evidence on the emerging benefits of scale arising from the consolidation of small defined contribution (DC) schemes into master trusts. It complements the Department for Work and Pensions’ analysis of pension fund investment and the UK economy and contributes to a growing understanding of how scale can support better value for members. We also explore the links between scale, governance capability and access to private market investment.
While the UK evidence base is still developing and will strengthen over time, this report supplements domestic evidence with insights from Australia, where large-scale DC funds have been established for longer and operate at significant economic scale.
Published: 7 May 2026
Consolidation and scale trends
Our DC landscape analysis shows the growth in scale of the market:
- Membership in occupational DC schemes continues to increase, primarily due to the rise in the number of deferred members.
- The number of occupational DC and hybrid schemes decreased by 15% over the last year, from 920 schemes in 2024 to 790 in 2025 (excluding micro schemes).
- Assets grew by 22%, from £205 billion in 2024 to £249 billion in 2025, to be more than 10 times larger than in 2011 – when assets were £22 billion.
- Master trusts held £208 billion in assets, 83% of the total (excluding hybrids).
- Master trusts had 30.1 million memberships (92% of all DC and hybrid memberships in non-micro schemes).
- Master trusts have grown to significant scale following the advent of automatic enrolment (AE) in 2012 and the subsequent authorisation regime for master trusts. They now account for a majority of members and assets in the occupational DC market.
- Large (5,000+) membership DC schemes have 98% of occupational DC assets.
Figures 1 and 2 show how membership and assets have grown over time.
Figure 1: Memberships of occupational DC schemes by membership size group (including hybrid schemes, but excluding micro schemes) (2011 to 2025)
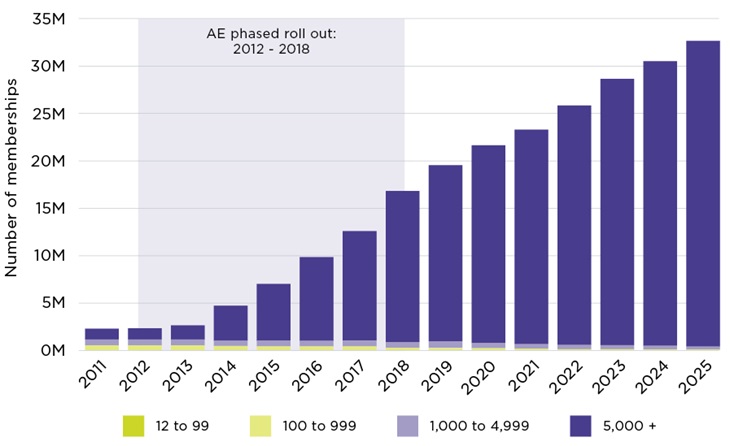
Figure 2: Total assets, split by membership in occupational DC schemes (excluding hybrid schemes and micro schemes) (2011 to 2025)
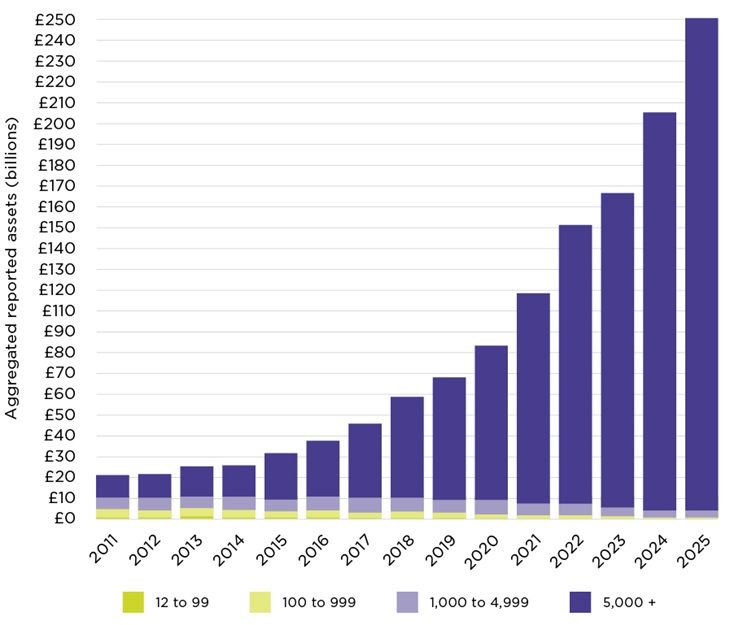
Source: Occupational defined contribution landscape in the UK, 2025.
Figure 1 shows that AE has been a main driver of scale, as it drove mass participation in pension saving. Growth in membership, much of which was in newly authorised master trusts, has driven a significant increase in assets under management (AUM), as shown in figure 2, and it is this concentration of assets in larger schemes that underpins the current focus on scale.
To drive greater scale in the market, government will require a minimum £25 billion for the main default fund of multi-employer pension schemes – see Pension Schemes Bill: Scale and Consolidation guidance for details of this policy. The government’s stated aim is to support a more consolidated and efficient market that delivers better long-term outcomes for members. In particular, for a scheme to be approved for AE purposes, group personal pensions (GPPs) and many master trusts will need to have at least one main scale default arrangement of at least £25 billion in AUM by 2030. These new scale requirements will start no earlier than 1 January 2030, with some exemptions set out in future secondary legislation.
Published evidence on fees and scale
With respect to economies of scale, a DWP report on the DC pensions market concluded that larger schemes are able to negotiate lower service provider fees and can generally operate more efficiently. Even a small reduction in annual management charges could translate into better outcomes. DWP’s analysis also shows that a median earner could have around £3,000 more in their pension pot due to lower charges from moving into a larger master trust.
The Australian Government Productivity Commission found that, holding other cost drivers constant, larger scale was strongly associated with lower average expenses. This relationship was particularly pronounced for administration expenses, where realised economies of scale were greater than for investment expenses, and this relationship held consistently across the landscape.
Cost per member and scale
We have undertaken indicative analysis of cost per member across 29 active master trusts using recently acquired data. This analysis uses the most recently available data submitted by schemes, covering the 2023 to 2025 period. Schemes have been grouped by membership size to explore how costs per member vary across the market. Further detail on the data and methodology is found in Annex 1.
Figure 3 is, therefore, new analysis, and shows the following:
- Total costs per member generally decrease, as size increases.
- The smallest schemes have higher median average cost per membership.
- Smaller schemes show greater variation in costs per membership.
Annual management charges tended to be higher in multi-employer provider schemes than in single employer trusts (SETs) – with median averages of 0.32% and 0.24% respectively – according to the Pension Provider Survey 2024/25. (However, response rates were quite low as a share of the SET market and it is also possible that some employers may subsidise costs in SET schemes).
Figure 3: Median and interquartile range of total cost per membership by scheme size (indicative analysis)
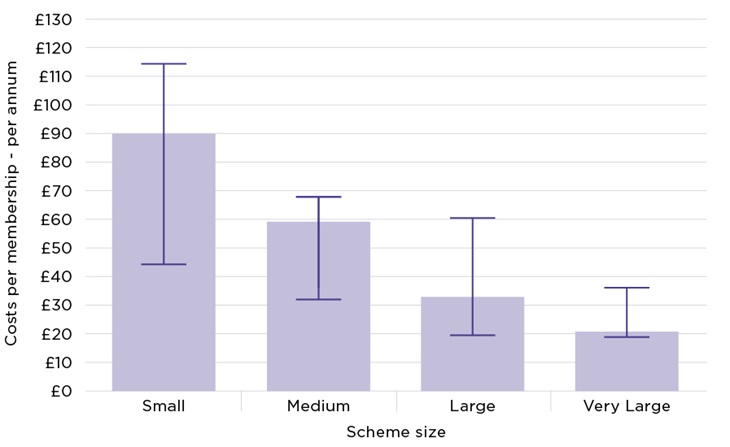
Source: TPR analysis.
Note: Analysis of active schemes. Two schemes have been removed from the analysis. Error bars show the interquartile range (25th to 75th percentile).
Size bands: Small: <20,000 memberships, Medium: 20,000 to <190,000 memberships, Large: 190,000 memberships to < 500,000 memberships, Very Large: > 500,000 memberships.
The patterns in Figure 3 are consistent with economies of scale being secured at larger scale in master trusts, with members in smaller schemes more likely to face higher costs. Nevertheless, some cost increases may be justified if they unlock better value assets for members.
Data on asset allocation in an evolving landscape
There is currently limited granular data on asset allocation in DC ahead of the value for money (VFM) data becoming available in coming years.
According to the Pension Provider Survey 2024/25, single employer trust schemes are more likely to invest in UK listed equities than multi-employer providers, e.g. master trusts. For savers at 30 years to retirement, this allocation was 9.9% of assets under management in SET schemes compared with 2.6% in multi-employer provider schemes. (Again, response rates were quite low for the SET schemes so the reader should exercise caution in interpreting this result.)
TPR released a 2024 report on the DC trust based pension system that showed 23% of schemes held one or more investments into infrastructure, private equity, venture capital, renewables or in LTAFs. This proportion also increased in line with scheme size (ranging from 17% of micro schemes to 72% of master trusts). The majority of funds with these investments had invested some or all of their portfolio in the UK.
The ABI tracks progress against the Mansion House Compact. The ABI’s latest update shows that investment in unlisted equities held through DC default funds has doubled since last year, growing from £0.8 billion to £1.6 billion. This increase reveals a growth in funds’ exposure to unlisted equities from 0.36% to 0.6%, marking further progress towards the Compact’s ambition to allocate at least 5% by 2030.
Investment returns and scale
The current UK evidence linking scheme size with gross investment returns is weak.
- A report into DC market trends published by DWP generally shows no correlation between AUM size and investment performance, whether for master trusts or GPPs in the UK.
- Annex E of the Pension Provider Survey 2024/25 shows that the median annualised investment performance was higher in single employer trusts than in multi-employer schemes. However, it also shows wide variations in performance between the highest and lowest performers.
- Research by CEM into the benefits of scale found that the advantages of scale most prominently manifest themselves in the ability to implement private assets internally, resulting in much lower overall private asset management costs. This drives the overall return higher, net of costs.
The forthcoming VFM framework will provide standardised, comparable data on returns, sharpening the focus on net returns and return volatility in assessing good outcomes for members.
In Australia, some evidence suggests there is a modest positive relationship between AUM size and investment performance. Estimates in a study into the Australian superannuation sector indicate that a doubling of fund size was associated with an annual improvement in relative returns of around 5 basis points in very large schemes. According to the report, this relationship could be driven by scale efficiencies, such as fixed costs in internal investment management or greater negotiating power for outsourced investment management services. However, we note that larger funds are also likely to have the potential to achieve stronger returns performance through measures such as investment governance, paying higher salaries to attract board members and investment professionals, and getting access to specialist advisors such as tax specialists.
Private market investment and scale
The UK DC sector is on a journey to allocating more to private markets, supported by the Mansion House Accord and the scale requirements. The intention of schemes to allocate more to private markets in the future was demonstrated in TPR's 2024 report on the DC trust based pension system.
New data on allocations to private markets will become available later this year, and this will enable us to create a benchmark to track growth in this allocation over time within the UK DC sector.
In the larger Australian DC system, evidence shows a strong link between scheme size and allocation to private markets. As figure 4 shows, putting the schemes in the study into four groups by assets under management, the largest quarter of schemes (Q1) allocate roughly double the investment to unlisted assets as the smallest schemes (Q4). The difference is particularly notable in private equity and unlisted infrastructure.
However, the reader should note that there are important differences in the tax treatment of pensions investment in the UK and Australia that may have an impact on the attractiveness of private market investment, apart from any scale effect.
Figure 4: Asset allocation by size quartile (AUM), Australia
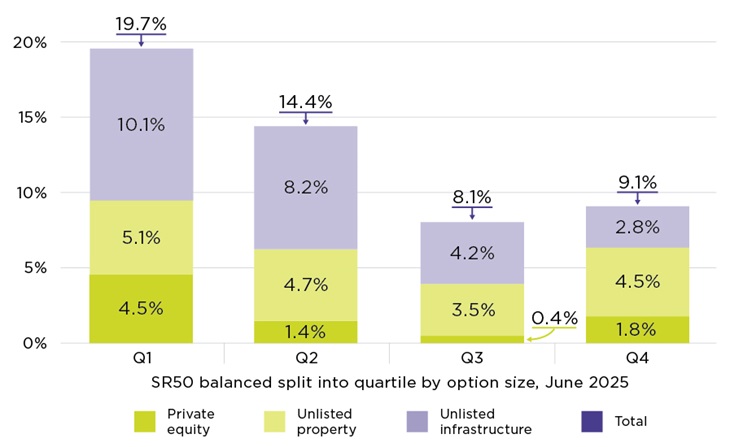
Source: JANA Investments estimates based on SuperRatings AA data and APRA data.
Chart taken from UK pension schemes and productive finance - a framework for effective intervention.
Scale matters for access to private markets, particularly when it comes to being able to develop an in-house direct investment team and portfolio. These opportunities can enable trustees to access investments that offer alternative sources of return and income, and different risk and correlation characteristics from other assets.
We have published private markets guidance for trustees considering private market investment. Accessing these benefits requires effective governance capabilities, explored in the next section.
Governance and scale
Good governance ensures schemes are well-run and that issues are managed effectively. It provides trustees with oversight of the day-to-day running of the scheme, clear accountabilities and delegations, and confidence that legal requirements are being met.
TPR are raising expectations around investment governance. Trustees should ensure that decisions are long-term, well-evidenced, and subject to appropriate challenge. Through our Market Oversight team, we are having more expert-to-expert conversations with schemes about governance, which is particularly important as schemes prepare for the introduction of the value for money programme.
The findings from our 2025 DC schemes survey highlight the significant differences between small and large DC schemes:
- Large schemes and master trusts display near-universal awareness of our general code of practice, strong governance generally, high capability in relation to environmental, social and governance requirements and investment good practice, and strong VFM processes.
- Micro and small schemes continue to lag significantly across all areas compared to larger schemes, especially in relation to cyber security, trustee knowledge and understanding and compliance with VFM.
- Professional trustees have the greatest positive impact on the quality of governance in the smallest schemes.
Australian studies have found that better governance leads to better returns and that larger funds tend to govern better. This leads to higher benchmark-adjusted returns, consistent with larger funds making better investments within each asset class.
The UK has yet to generate equivalent evidence but the conditions for doing so are emerging.
Conclusions and next steps
This report has summarised some key aspects of the evidence on the benefits of economies of scale. There is some evidence emerging of economies of scale benefits, but this is not unequivocal or guaranteed, therefore the market must remain alert and responsive to risks and opportunities. It will take time for UK pensions to build the size and the systems needed to take full advantage of the opportunities of scale.
We will be publishing further evidence on asset allocation later this year and will continue to track developments over time.
Annex 1: Master trust cost data methodology and notes
This annex provides further information on figure 3 in this report. Our analysis covers 29 master trusts, excluding two others that are in the process of winding up. See the list of authorised master trusts.
Methodology
Our analysis is derived from administrative data submitted by master trusts through the scheme financial template.
Schemes are segmented by membership size into four categories:
- Small schemes have fewer than 20,000 memberships.
- Medium schemes have between 20,000 and 190,000 memberships.
- Large schemes have over 190,000 and fewer than 500,000 memberships.
- Very Large schemes have over 500,000 memberships.
Master trusts have been divided into four size categories based on membership, with thresholds set to create approximately equal master trusts within each group. This allows us to show general trends but without being disclosive.
Data limitations
Total cost per member reflects scheme reported costs as submitted through the scheme financial template. This includes administration, investment and operational costs borne by the scheme.
All data used in this analysis have been through our standard validation checks applied to operational reporting data. In this way, we have worked with schemes to identify and correct any reporting errors as far as possible.
Where schemes pass costs directly to members rather than bearing them centrally, these may not be captured in reported figures which could affect the comparability across some schemes.
Scheme financial templates are submitted at different points in time, meaning data for individual schemes may relate to different reporting periods between 2023 and 2025. The median average is used rather than the mean to reduce the influence of schemes with costs that may exhibit exceptional behaviour within a particular reporting period.
The data may be skewed by big auto-enrolment schemes where the lower cost per member comes more from the number of members than the level of AUM. Some of these schemes also have the lowest average pot sizes, so the costs as a proportion of a member’s pot (ie what will impact member outcomes) could be higher.