
Occupational defined benefit scheme funding analysis 2026
This is an official statistics publication produced by The Pensions Regulator (TPR). This annual publication provides an overview of funding levels and recovery plans in occupational defined benefit (DB) and hybrid pension schemes in the UK. Additional data used in the calculations are available in the annex to this report.
Terms used throughout the report are available at the end of the document in the glossary.
Published: 15 September 2026
Introduction
This publication is based on tranche 19 schemes, with effective valuation dates from 22 September 2023 through 21 September 2024, inclusive.
Schemes typically submit funding data to us every three years. This means tranche 19 belongs in the same cohort of schemes as tranches 16, 13, 10, 7, 4 and 1. Table 1.1 in the annex details which tranche of schemes belong to which funding cycle.
By June 2026, we received 1,540 valuations with an effective valuation date covered by tranche 19. 1,480 of these schemes also submitted a tranche 16 valuation.
Of the tranche 19 valuations, 68% of these schemes had submitted valuations in all previous funding cycles.
A note on future changes to this publication
Please note that this is expected to be the last publication of our DB funding analysis in its current format. TPR’s new funding code came into force for valuation from 22 September 2024. We will be reviewing how this new data is used to shape the future direction of these statistics. Please contact us at: evidenceandinsight@tpr.gov.uk if you would like to share views on the future direction of this publication.
Key findings
- 67% of schemes reported a surplus position in tranche 19. This compares with 39% in tranche 16.
- The average (mean) assets to technical provisions (TP) liabilities ratio for schemes in tranche 19 was 106% (median: 104%). This compares with 94% (median: 95%) in tranche 16.
- The average (mean) recovery plan length for schemes in deficit was 4 years (median: 3.2 years), with a median end date falling in 2027. For comparison, the average (mean) recovery plan length in tranche 16 was 5.7 years (median: 5 years).
Funding levels
Figure 1: Assets to TP liabilities ratio (all schemes, all relevant tranches)
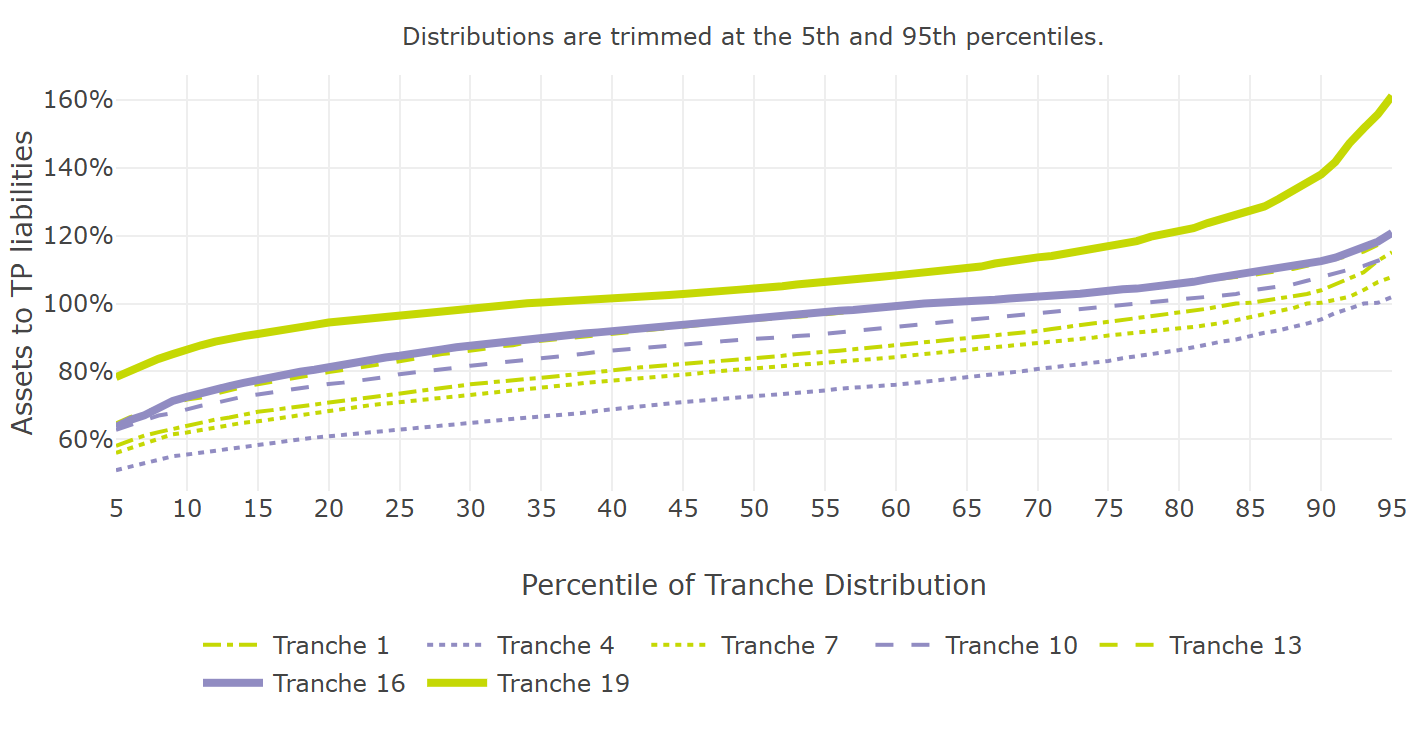
Table 1: Number of schemes (all schemes, all relevant tranches)
| Tranche 1 | Tranche 4 | Tranche 7 | Tranche 10 | Tranche 13 | Tranche 16 | Tranche 19 |
|---|---|---|---|---|---|---|
| 2,560 | 2,200 | 1,990 | 1,840 | 1,770 | 1,730 | 1,540 |
Overall, 67% of schemes reported a surplus on the TP funding basis in tranche 19, compared with 39% in tranche 16.
The average (mean) assets to TP liabilities ratio was 106% in tranche 19 (median: 104%), compared with 94% in tranche 16 (median: 95%), representing a 12 percentage point increase between funding cycles.
Funding levels have improved in the current tranche compared with tranche 16 across all scheme size categories (Figure 2). The largest median assets to TP liabilities ratio, but also the largest variation in funding levels, is seen in the group of the smallest schemes (with less than 100 members each).
Figure 2: Assets to TP liabilities ratio by scheme membership size (tranche 16 and tranche 19, all schemes)
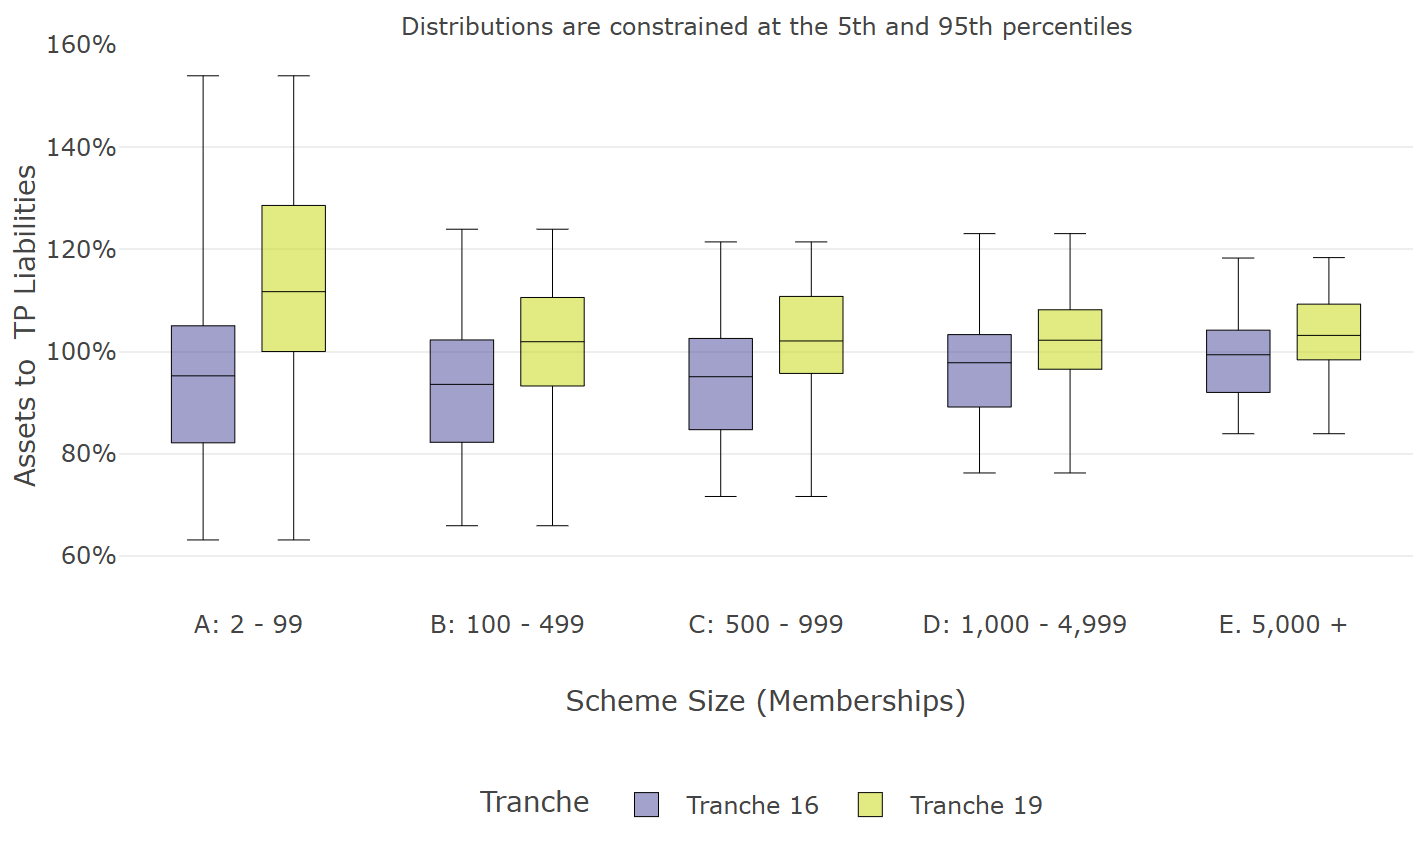
Table 2: Number of schemes by scheme membership size (tranche 16 and tranche 19, all schemes)
| Scheme size | Tranche 16 | Tranche 19 |
|---|---|---|
| A: 2 - 99 | 620 | 550 |
| B: 100 - 499 | 540 | 490 |
| C: 500 - 999 | 200 | 180 |
| D: 1,000 - 4,999 | 240 | 220 |
| E. 5,000 + | 130 | 110 |
| Total | 1,730 | 1,540 |
Recovery plans
Schemes that have a funding deficit at the effective date of their actuarial valuation are required to prepare a recovery plan to achieve full funding in relation to TP liabilities. A scheme’s recovery plan end date is set by adding the length of the recovery plan to the date of its commencement.
In tranche 19, 510 schemes (33%) were required to submit a recovery plan, compared with 1,060 schemes (61%) in tranche 16.
The average recovery plan length in tranche 19 was 4 years (median: 3.2 years). The equivalent recovery plan length in tranche 16 was 5.7 years (median: 5 years). The reduction in average recovery plan length from tranche 16 to tranche 19 was 1.7 years (median: 1.8 years). The equivalent reduction in average recovery plan length from tranche 13 to tranche 16 was 0.8 years (median: 0.5 years).
In tranche 19, the median recovery plan end date is anticipated to fall in 2027, compared with 2026 in tranche 16.
Figure 3: Distribution of recovery plan end dates (schemes in deficit, all tranches)
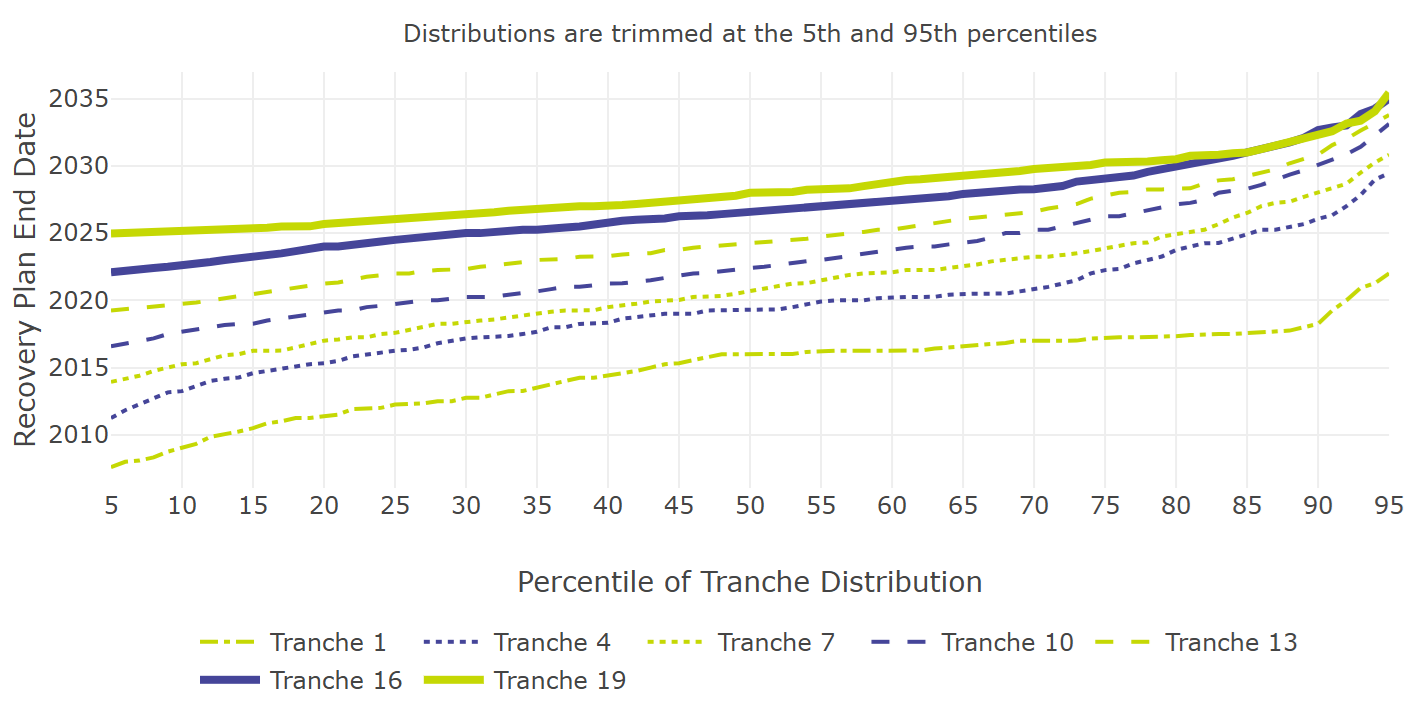
Table 3: Number of schemes in deficit (all tranches)
| Tranche 1 | Tranche 4 | Tranche 7 | Tranche 10 | Tranche 13 | Tranche 16 | Tranche 19 |
|---|---|---|---|---|---|---|
| 2,120 | 2,050 | 1,770 | 1,400 | 1,110 | 1,060 | 510 |
Considering the three-year inter-valuation period, a reduction in recovery plan length of more than three years between tranches means bringing forward the date at which the scheme is anticipated to be fully funded.
Among the 430 schemes in deficit in both tranches, 84% reported reductions in their recovery plan length (Figure 4). For 47% of schemes this reduction was more than three years – meaning the finish date has been retained or brought forward.
For a further 37% the reduction was less than three years, meaning the finish date is later than at the previous valuation. For the remaining schemes the recovery plan is broadly the same length or longer.
Figure 4: Changes in recovery plan length between tranche 16 and 19 (representing 430 schemes which were in deficit in both tranches)
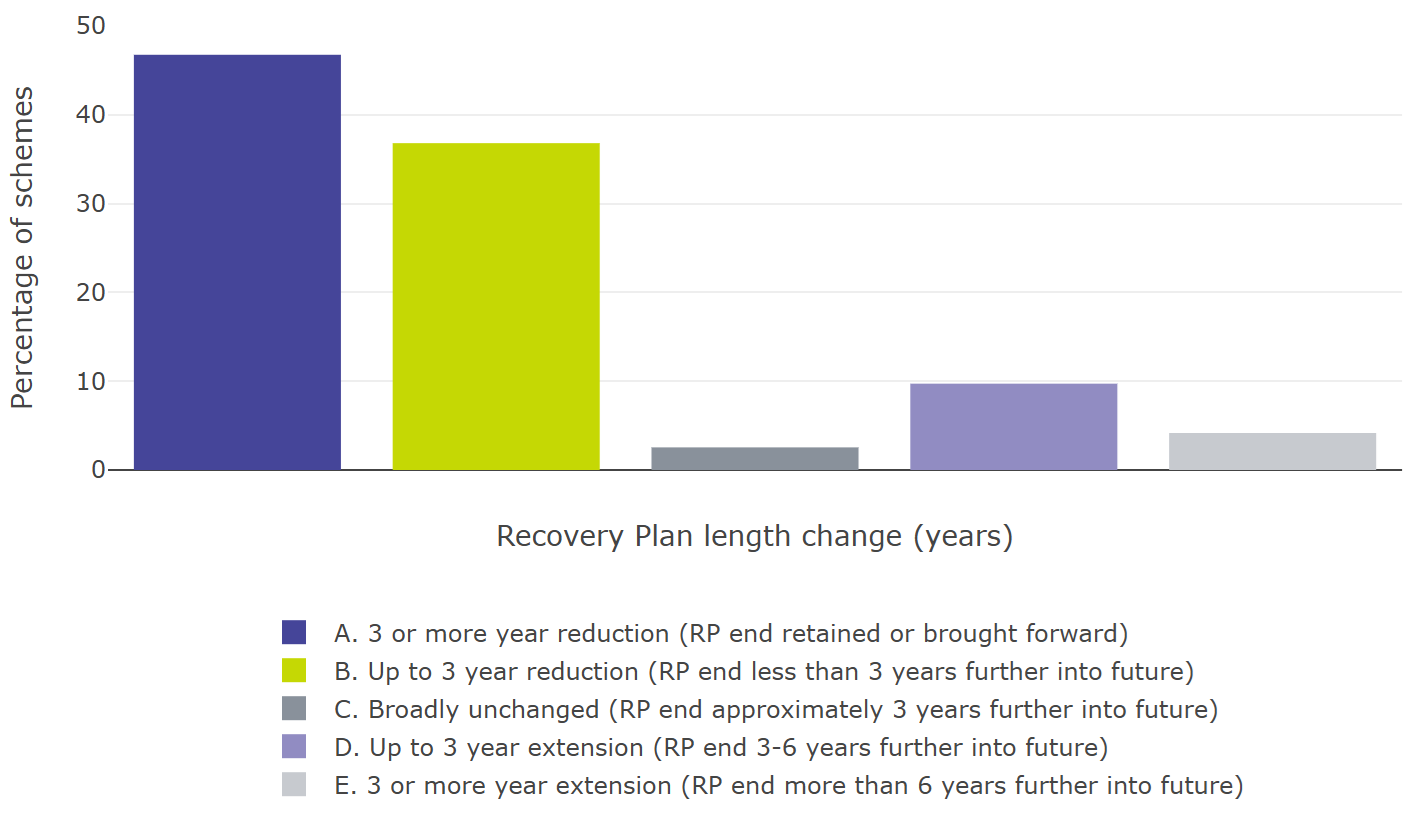
Table 4: Number of schemes in deficit (tranche 16 and 19)
| Recovery Plan length change (years) | Number of schemes |
|---|---|
| A. 3 or more year reduction (RP end retained or brought forward) | 200 |
| B. Up to 3 year reduction (RP end less than 3 years further into future) | 160 |
| C. Broadly unchanged (RP end approximately 3 years further into future) | 10 |
| D. Up to 3 year extension (RP end 3-6 years further into future) | 40 |
| E. 3 or more year extension (RP end more than 6 years further into future) | 20 |
| Total | 430 |
Recovery plan lengths were shorter in the current tranche compared to tranche 16 in all membership size categories, when comparing all schemes in deficit in each tranche (Figure 5).
Figure 5: Distribution of recovery plan length by scheme membership size and tranche (tranche 19 and tranche 16 schemes in deficit)
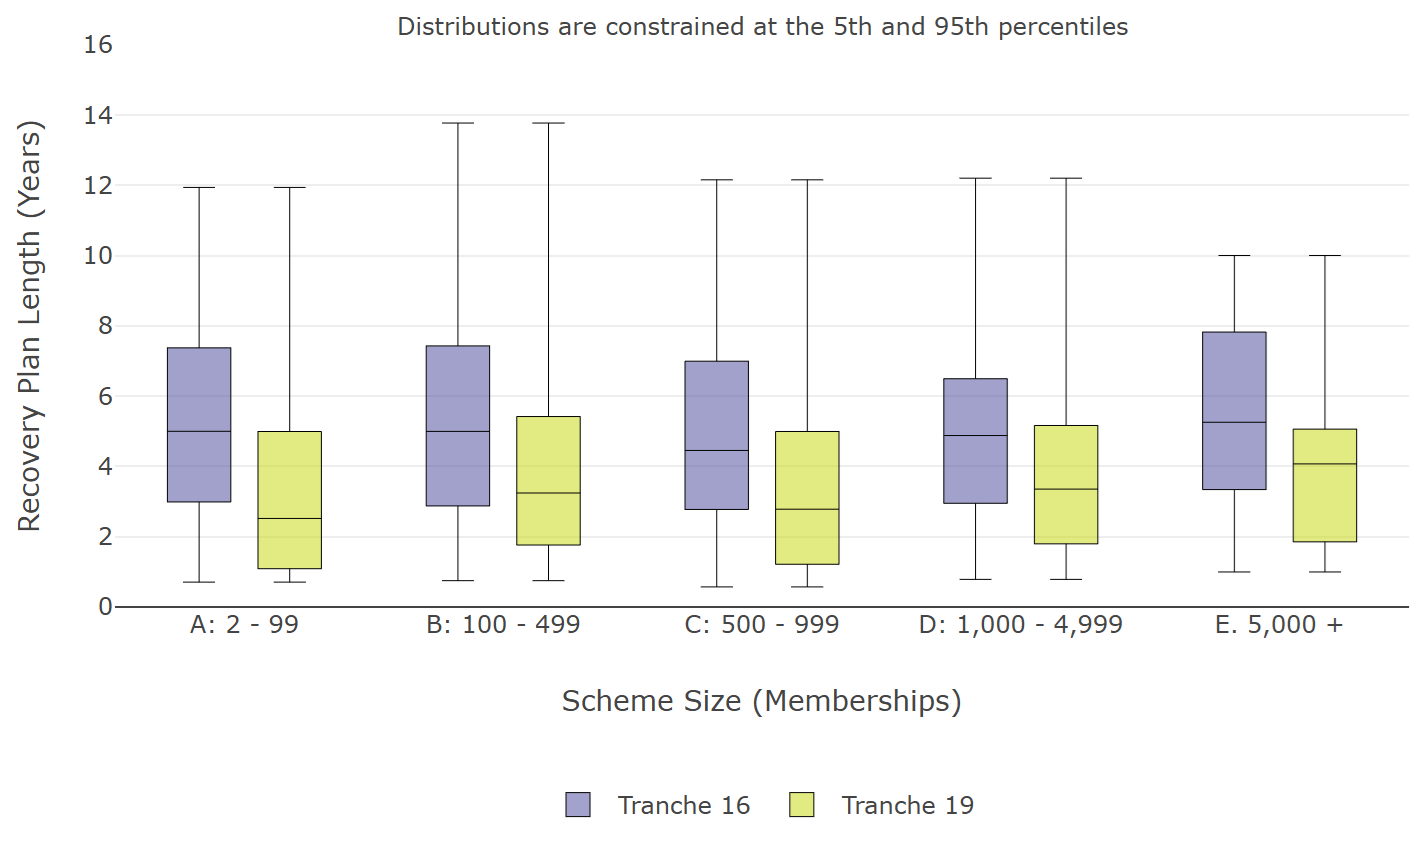
Table 5: Number of schemes by scheme membership size (tranche 19 and tranche 16 schemes in deficit)
| Scheme size | Tranche 16 | Tranche 19 |
|---|---|---|
| A: 2 - 99 | 370 | 130 |
| B: 100 - 499 | 350 | 200 |
| C: 500 - 999 | 130 | 70 |
| D: 1,000 - 4,999 | 140 | 80 |
| E. 5,000 + | 60 | 30 |
| Total | 1,060 | 510 |
Using this publication
Data sources
The data contained in this statistical release was submitted by schemes to TPR in triennial valuation summaries, their associated recovery plans, and annual scheme returns. The analysis builds on previous releases and includes tranche 19 valuations and associated recovery plans received up to June 2026. 1,540 occupational DB and hybrid schemes have submitted valuations to TPR in tranche 19.
Tranches
Tranche 19 is the first tranche of the seventh cycle of the scheme funding regime, generally reflecting the seventh valuation of this cohort of schemes. Tranche 19 has due dates for submission to TPR between December 2024 to December 2025.
Table 1.1 in the annex details which tranche of schemes belong to which funding cycle. Tranche 19 belongs in the same cohort as tranches 16, 13, 10, 7, 4 and 1. However, these cohorts do not contain exactly the same schemes. Reasons for this difference include schemes:
- carrying out valuations more frequently than every three years
- submitting the results of the valuation to TPR late
- that are wound up or in the process of winding up
- that are new (for example, as a result of reorganisations, mergers, buyouts or transferring all members to a new scheme)
- that have transferred to the Pension Protection Fund (PPF)
Considering the three-year valuation cycle, schemes typically submitting valuations in tranche 19 would have submitted their previous valuation in tranche 16. This means in most cases, tranche 16 data is the most appropriate comparison with the latest tranche.
Assets, liabilities, deficits and surpluses
Assets, liabilities, deficits and surpluses in this bulletin are defined on a TP basis. Where a scheme is sectionalised or segregated, each section is treated as if it were a separate scheme for this report. The dataset counts each segregated section of assets and liabilities as a separate scheme for the purpose of these funding statistics. Therefore, each ‘scheme’ in this data may represent a pension scheme with a single section, or a segregated section within a sectionalised pension scheme. Throughout this publication ‘scheme’ is used as shorthand for ‘scheme or segregated section’.
The data presented in this report is as submitted by the scheme, and not rolled forward to a common date.
The data used to produce our official statistics is collected from all occupational DB and hybrid schemes. As some individuals may have a number of pension entitlements spread over a number of schemes, they may be included more than once in the total memberships under consideration.
The summaries on mortality assumptions in the annex are based on current male pensioners aged 65 only, unless otherwise stated.
The latest figures on DB scheme membership along with rolled forward asset and liability positions can be found in our occupational DB landscape publication: Occupational defined benefit landscape in the UK 2025.
Methodology
These statistics report on administrative data and actuarial calculations derived from it. Accuracy of administration data is addressed by eliminating data errors as far as possible. Potential sources of error include the following:
- Schemes entering data incorrectly as part of their valuations
- Data processing while creating structured datasets from the scheme valuations input and any manual corrections as part of that process
- Mistakes in the programming code used to analyse the data and produce the statistics, and by analysts interpreting the data incorrectly
Further, the figures shown here are the results of actuarial calculations. These are based on assumptions for schemes’ future experience. In practice, the cost of providing benefits within these schemes will vary according to the schemes’ actual future experience, not the assumptions made. This experience will inevitably not be exactly in line with the assumptions made.
Throughout this publication all percentages are rounded to the nearest whole percent, whilst recovery plan lengths are rounded to one decimal place. Numbers of schemes have been rounded to the nearest 10. Where ‘average’ is used in the report, it refers to the mean. Figure totals and percentages may not sum to expected values due to rounding. Weighted averages are weighted by TP liabilities.
In the annex, mortality rates are the exception, which are rounded to whole numbers. Discount rates and outperformance measures are rounded to three decimal places. Scheme counts and number of members are not rounded.
Owing to the scheme-specific nature of the data, individual data points cannot be presented. As such, data distributions start and end at the 5th and 95th percentiles respectively, and in some instances group ranges have been broadened to include figures comprising fewer than 10 observations.
Comparisons with previous DB funding statistics
Where schemes have made updates to submissions on historic tranches, these updates are included in this publication and its annex. For this reason, you should always use the current publication to access statistics for historic tranches rather than referring to previous publications.
Discount rates (annex tables 4.1 to 4.11)
The discount rate assumption is reported to TPR by schemes in one of two formats:
- A single investment return.
- Different investment returns for pre-retirement and post-retirement benefits.
For the purposes of comparison, in instances where different rates have been reported, a single effective discount rate (SEDR) is calculated. This is based on the single rate or, where a different rates approach has been adopted, constructed from both the pre- and post-retirement rates. The SEDR is calculated as a weighted average of the pre-retirement discount rates and post-retirement discount rates. The weights are based on the pre- and post-retirement durations and on the value of TPs for active, deferred and pensioner members.
The duration parameters used in the above method are estimated on a scheme-by-scheme basis, using data provided to us in the annual scheme return and valuation returns. Using the above method the SEDR has been calculated for all schemes (schemes in deficit only for tranches 1 to 7; all schemes for tranches 8 to 19), and as the duration parameters have changed for tranches 18 and 19, historical positions will differ to earlier publications.
The outperformance of the SEDR is calculated using gilt yields that reflect the average duration of liabilities. For tranches 18 and 19, 15-year gilts (nominal and real) are used to reflect a shorter average duration, whereas previous tranches continue to use 20-year gilts. As a result, the levels of outperformance assumed may differ from those shown in previous reports.
Deficit reduction contributions (annex table 3.4)
Average annual deficit reduction contributions (DRCs) summarised in annex table 3.4 are calculated as the average of DRCs over the first four years of the recovery plan.
Covenant groups (throughout annex)
Covenant Groups (1 to 4) are assigned at the point of initial recovery plan reviews to facilitate prioritisation. These grades may differ from the view taken during case-level intervention, where a wider range of information is taken into account. They are defined as:
- Covenant group 1: strong
- Covenant group 2: tending to strong
- Covenant group 3: tending to weak
- Covenant group 4: weak
Covenant assessments are not usually undertaken for schemes in surplus.
Contact
If you have a specific enquiry about our scheme funding analysis 2026 official statistics, please contact: evidenceandinsight@tpr.gov.uk.
Glossary
00 series base mortality table (00 series)
Based on 1999 to 2002 experience collected from UK insurance companies.
08 series base mortality table (08 series)
Based on 2007 to 2010 experience collected from UK insurance companies.
16 series base mortality table (16 series)
Based on 2015 to 2018 experience collected from UK insurance companies.
92 series base mortality table (92 series)
Based on 1991 to 1994 experience collected from UK insurance companies.
Actuarial valuation
A comparison by the actuary of the value placed on scheme assets with the TP liabilities and an assessment of any future contribution requirement. Calculation of the TP liabilities is usually based on full member-by-member data.
Buyout liabilities (or section 75 or solvency)
This refers to the scheme actuary’s estimate of the cost of securing scheme liabilities with annuities purchased from a regulated insurance company. This may be used as the solvency estimate as part of the actuarial valuation for a scheme in windup. Sections 75 and 75A of the Pensions Act 1995 provide for the calculation of a debt on the employer on the buyout basis (a section 75 debt) if a scheme winds up, or if an employer becomes insolvent or ceases to participate in a multi-employer scheme. Throughout this publication, the term ‘buyout’ is used. In a small number of cases, an alternative measure of solvency is submitted to us. In this case, this will be the data that has been used in this analysis and there is no distinction made.
Contingent assets
Contingent assets are assets on which a claim by the pension scheme would exist on the occurrence of one or more specified future events (‘the contingent event’). This includes movements in corporate asset holdings, increased employer borrowing, employer failure, or failure to achieve a specified funding level. Unless the events occur, these assets are not available to the trustees to meet members’ benefit payments. They are not included as scheme assets for the purpose of assessing whether a scheme meets its statutory funding objective (for example, that assets are sufficient to cover TP liabilities) until they are transferred to the scheme.
Continuous Mortality Investigation (CMI)
The CMI Mortality Projections, created by the UK Actuarial Profession, are based on a deterministic model driven by user inputs. The model is based on the assumption that current rates of mortality improvement converge to a single long-term rate. CMI_2023 was published in April 2024, CMI_2024 was published in June 2025, and CMI_2025 was published in March 2026.
Deficit reduction contributions (DRCs)
These are contributions made by sponsors to the scheme to address any asset to TP liabilities deficit, in line with the schedule of contributions and the recovery plan.
Defined benefit (DB)
A pensions scheme for which benefits are worked out using a formula that is usually related to the members’ pensionable earnings and/or length of service. These schemes are also referred to as ‘final salary’ or ‘career average salary’ pension schemes.
Different rates
Where separate discount rates are reported in respect of pre-retirement and post-retirement benefits in the valuation of liabilities. (See also ‘single rates’).
Discount rate
A discount rate is a rate of compound interest which is used to calculate the present value of a sum due at a later time. This action discounts the sum due to its value today. It inherently assumes that the present value is invested and has to earn the chosen discount rate to achieve the sum due at the later time. (See also ‘single rates’, ‘different rates’).
Effective date (valuation date)
An actuarial valuation or an actuarial report considers the funding of a scheme as at a particular date, known as the effective date. The effective date will be earlier than the date on which calculations are done. The effective date of a scheme’s first Part 3 valuation cannot be before 22 September 2005.
Hybrid scheme
A pensions scheme that provides a combination of DB and defined contribution (DC) benefits, either in separate sections or from built-in features that make sure members get at least a minimum promise, as well as any investment value.
Part 3 valuation or scheme funding valuation
An actuarial valuation meeting the requirements of Part 3 of the Pensions Act 2004 concerning the funding of DB pension liabilities, which apply to any actuarial valuation received by trustees (on or after 30 December 2005) that is based on an effective date of 22 September 2005 or later.
Pension Protection Fund (PPF)
A corporate body established under the Pensions Act 2004. The PPF was set up to provide compensation to members of eligible DB pension schemes. This is when there is a qualifying insolvency event in relation to the employer, and where there are insufficient assets in the pension scheme to cover the PPF level of compensation.
Pension protection levy
This is the annual amount that a pension scheme is charged by the PPF. It is normally composed of a scheme-based levy and a risk-based levy. The scheme-based levy is payable every year and the risk-based levy is payable when circumstances require.
Recovery plan (RP)
Under Part 3 of the Pensions Act 2004, where there is a funding shortfall at the effective date of the actuarial valuation, the trustees must prepare a plan to achieve full funding in relation to the TP liabilities. The plan to address this shortfall is known as a recovery plan.
Recovery plan length
The recovery plan length is the period of time it is assumed a scheme will take to eliminate any shortfall at the effective date of the actuarial valuation. This is so that by the end of the recovery plan it will be fully funded in relation to the TP liabilities.
Scheme
In this publication, ‘scheme’ refers to a segregated section of assets and liabilities. This may represent a pension scheme with a single section, or a segregated section within a sectionalised pension scheme.
Section 179 liabilities (s179)
This refers to a valuation of a scheme’s funding level relative to the PPF compensation which would be payable to its members if they transferred to PPF. See section 179 of the Pensions Act 2004. This measure is designed to be a close approximation to the liability measure that would be used to decide whether the PPF would need to take on the scheme were the employer to become insolvent. In contrast to TP liabilities, the assumptions to be used in an s179 valuation are prescribed by the PPF and are standard across all schemes. They are designed so that s179 is close to the cost of securing the valued benefits with an insurance company at the valuation date.
Section 179 (s179) valuation
To calculate the risk-based pension protection levy (where it applies), the PPF board must take account of scheme underfunding. To obtain a consistent basis for determining underfunding, schemes must complete a PPF valuation (section 179). This valuation will be based on the level of assets and liabilities for the scheme. The liabilities will be based on the scheme benefits, taking into account key features of the levels of compensation paid by the board of the PPF, as set out in Schedule 7 of the Pensions Act 2004.
Self-administered schemes base mortality tables (includes ‘S1’, ‘S2’ ‘S3’ and ‘S4’ series)
Based on mortality experience of UK self-administered pension schemes. In October 2008, the CMI published the ‘S1’ Series; the first mortality tables to be based on UK pension scheme data. The S2 Series was issued in February 2014, the S3 Series was issued in December 2018 and the S4 Series was issued in February 2024.
Short-, medium- and long- cohort projections
A number of UK mortality studies have shown that the birth cohort of pensioners born around 1926 is, on average, living longer than those born earlier or later (the ‘golden cohort’). In 2002, the UK Actuarial Profession created three different cohort projections which take account of the ‘golden cohort’ effect, each projecting the future of the ‘golden cohort’ differently. The ‘short cohort’ projections assumed that the ‘extra’ improvement in longevity experienced by the golden cohort will last, for the most fortunate generation, until 2010 (before reverting to ‘normal’ levels of improvement). The ‘medium-cohort’ projections assumed the effect will last until 2020 and the ‘long-cohort’ projections assume the effect will last until 2040.
Note: short and medium cohort projections have not been used since tranche 10.
Single effective discount rate (SEDR)
A single composite discount rate and made up of constituents of the different discount rates reported, allowing approximately for the maturity of schemes. This approach is also used to normalise bases where the discount rate varies year-on-year. Please see the ‘Methodology’ section of this document for greater detail.
Single rates
Where a single discount rate has been reported in relation to the valuation of pre-retirement and post-retirement liabilities.
Technical provisions liabilities (TP liabilities)
The funding measure used for the purposes of Part 3 valuations (see above). The ‘TP liabilities’ are a calculation undertaken by the actuary of the assets. It is needed at any particular time to make provision for benefits already considered accrued under the scheme using assumptions prudently chosen by the trustees. In other words, what is required for the scheme to meet the statutory funding objective. These include pensions in payment (including those payable to survivors of former members) and benefits accrued by other members and beneficiaries, that will become payable in the future.
Tranches
‘Tranche’ refers to the set of schemes which are required to carry out a scheme-specific funding valuation within a particular time period. Schemes whose valuation dates fell from 22 September 2005 to 21 September 2006 (both dates inclusive) were in tranche 1, from 22 September 2006 to 21 September 2007 were tranche 2 (both dates inclusive) and so on. Because scheme-specific funding valuations are generally required every three years, schemes whose valuations are in tranche 1 will also be likely to carry out valuations in tranches 4, 7, 10, 13, 16 and 19.
Triennial valuation cycles (cycles)
Given that all schemes are required to submit a Part 3 valuation to TPR at least every three years, each three-year period (three valuation tranches), is referred to as a cycle. Cycle 1 corresponds to the first three valuation tranches (tranches 1, 2 and 3). Cycle 2 to the second three valuation tranches (tranches 4, 5 and 6) and so on. The majority of Cycle 2 plans (tranches 4, 5 and 6) are second valuations under the scheme funding regime. However, tranches 1 and 4 (2 and 5, and so on) do not constitute a perfect cohort.
Valuation summary
A form to be completed when a recovery plan and schedule of contributions have been agreed by the trustees and the employer, following an actuarial valuation.