Occupational defined benefit landscape in the UK 2025
This is an official statistics publication produced by The Pensions Regulator (TPR). This annual publication provides an overview of the occupational defined benefit (DB) and hybrid scheme landscape in the UK, reporting on scheme status, membership levels and assets under management.
Published: 16 December 2025
Important changes since last year
Membership data within the public sector has corrected previously reported data errors affecting membership counts. Data for 2025 has been corrected in this report. Care should be taken when comparing to previous reports.
Table: Comparison of the original and corrected public service data
| Status | Memberships prior to data correction | Memberships post to data correction | % of total memberships prior to data correction | % of total memberships post data correction |
|---|---|---|---|---|
| Active | 7,450,000 | 7,448,000 | 39% | 38% |
| Deferred | 5,371,000 | 6,359,000 | 28% | 32% |
| Pensioner | 6,160,000 | 5,977,000 | 32% | 30% |
| Total | 18,980,000 | 19,784,000 | 100% | 100% |
Key findings
- This year’s report contains 200 public sector DB schemes with 19,784,000 members and 5,060 private sector schemes with 9,174,000 members.
- As with previous years, the DB and hybrid landscape continues to shrink at a yearly rate of 3% on average. Schemes continue to close, with the percentage closed to future accrual (excluding those in wind-up) rising from 73% in 2024 to 74% in 2025.
- Membership in private DB and hybrid schemes has fallen by 3% since 2024 to 9,174,000. Schemes closed to future accruals are decreasing this year for the first time (from 5,656,000 in 2024 to 5,413,000 in 2025), a drop of 4%.
- The technical provisions (TPs) funding level has stayed the same at 118%. Assets and liabilities both fell by 10%. The percentage of schemes in TPs surplus is 82% in 2025, compared to 80% in 2024.
- There are equal pensioner members (47% of total members) and deferred members (46% of total members) in private schemes.
Section 1: Number of private schemes
This section examines the number of DB schemes in 2025, including time series data and segmentation by scheme status.
Scheme status describes the position of a scheme’s lifecycle from starting up to final closure. The statuses in this release are split between the following:
- Open schemes, where new members can join the DB section of the scheme and accrue benefits.
- Schemes closed to new members (CTNM), in which existing members can continue to accrue benefits but no new members can join.
- Schemes closed to future accruals (CTFA), where existing members can no longer accrue new years of service and no new members can join.
- Schemes that are in the process of winding up, as notified to TPR.
Figure 1.1: Distribution of schemes by status
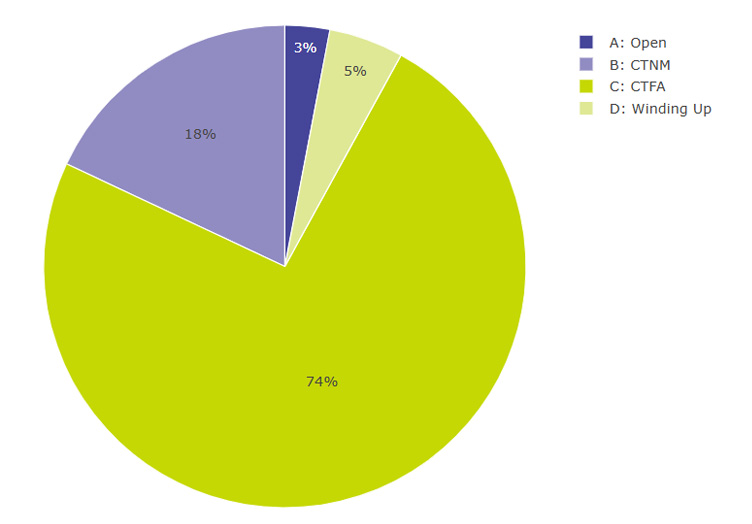
Figure 1.1 illustrates the lifecycle of schemes, transitioning from open, to closed to new members (CTNM), to closed to future accruals (CTFA), and eventually to winding up. The majority (74%) are in the closed to future accruals category.
Figure 1.2: Distribution of schemes by status and year
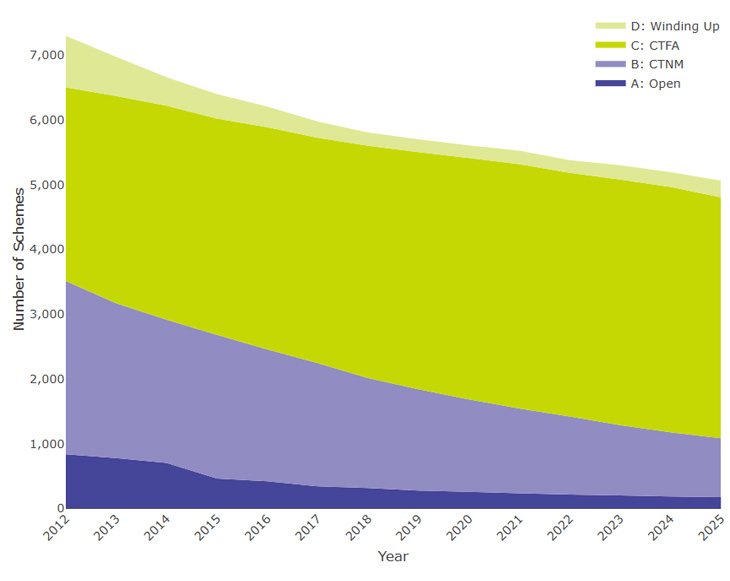
Figure 1.2 shows a yearly decline of 3% in average from the total number of schemes, from 7,300 in 2012 to 5,060 schemes remaining today (-31%). Notably, the number of closed to new members (CTNM) schemes has decreased rapidly (-66%), alongside winding up (-68%) and open schemes (-79%). In contrast, the closed to future accruals (CTFA) category is the only one to show a consistent increase (24%).
Figure 1.3: Scheme status by year excluding hybrid schemes
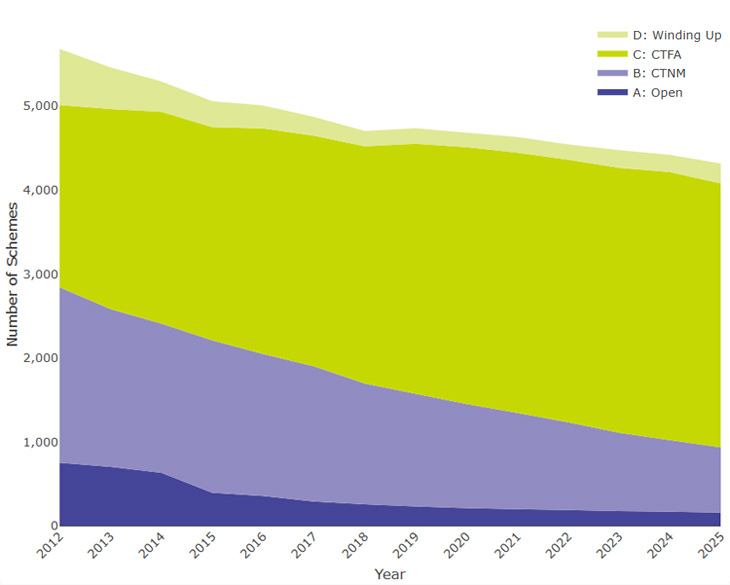
Figure 1.3 reflects that there are minimal changes in status distributions in 2025 in comparison to 2024 (excluding hybrid schemes). The percentage of closed to future accruals (CTFA) schemes (excluding those in wind-up) has risen from 76% in 2024 to 77% in 2025. Again, in comparison to 2012, the number of closed to new members (CTNM) schemes has decreased (-63%), alongside winding up (-65%) and open schemes (-79%). The closed to future accruals (CTFA) category is the only one to show a consistent increase (45%).
Figure 1.4: Distribution of schemes by status and membership group
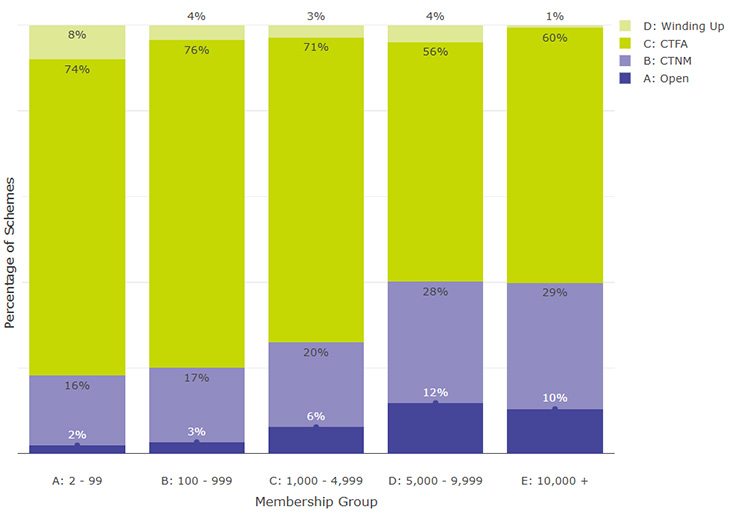
Figure 1.4 displays how scheme size and status are related, with a noticeable trend of larger schemes being more likely to remain open, while smaller schemes often tend to be categorised as closed to future accruals (CTFA). It is important to consider the actual numbers rather than just the percentages (refer to Figure 1.4 Table 1 in the annex), as there are fewer schemes in the D: 5,000 - 9,999 and E: 10,000 + categories, with 150 and 160 schemes respectively, representing just 3% and 3.2% of the total number of schemes (adding up to 6.2%).
Table 1.5: Proportion of schemes by principal employer type and status (% by employer type)
| Principal employer type | Memberships prior to data correction | Memberships post to data correction | % of total memberships prior to data correction | % of total memberships post data correction |
|---|---|---|---|---|
| Private limited company | 27% | 69% | 74% | 68% |
| Public limited company | 3% | 9% | 7% | 9% |
| Registered charity | 8% | 6% | 6% | 5% |
| Limited liability partnership | 0% | 0% | 2% | 4% |
| College or education institution | 16% | 2% | 1% | 1% |
| Partnership | 0% | 0% | 1% | 2% |
| Overseas company | 0% | 1% | 1% | 3% |
| Other | 46% | 13% | 9% | 8% |
| Total | 100% | 100% | 100% | 100% |
Table 1.5: Across closed to new members (CTNM), closed to future accruals (CTFA) and winding up schemes, the most relevant employer type is a private limited company. These account for 69% of closed to new members schemes, 74% of closed to future accruals schemes and 68% of winding up schemes. Open schemes have a more varied principal employer type with 27% as private limited companies, 16% in college/education and 46% in varied other principal employer types.
Table 1.6: Proportion of schemes by status and principal employer type (% by status)
| Principal employer type | A: Open | B: CTNM | C: CTFA | D: Winding up |
|---|---|---|---|---|
| Private limited company | 1% | 15% | 80% | 4% |
| Public limited company | 1% | 19% | 75% | 5% |
| Registered charity | 3% | 16% | 78% | 4% |
| Limited liability partnership | 0% | 2% | 89% | 9% |
| College or education institution | 29% | 27% | 41% | 4% |
| Partnership | 0% | 8% | 81% | 12% |
| Overseas company | 0% | 15% | 74% | 10% |
| Other | 10% | 20% | 67% | 3% |
Table 1.6:The majority of principal employer types, are closed to future accruals (CTFA), followed by closed to new members (CTNM). College or educational institutions are the exception, with 29%% of their schemes open.
Section 2: Memberships of private schemes
This section examines the number of memberships in private DB schemes, including time series data and segmentation by scheme status.
Figure 2.1: Distribution of membership by status
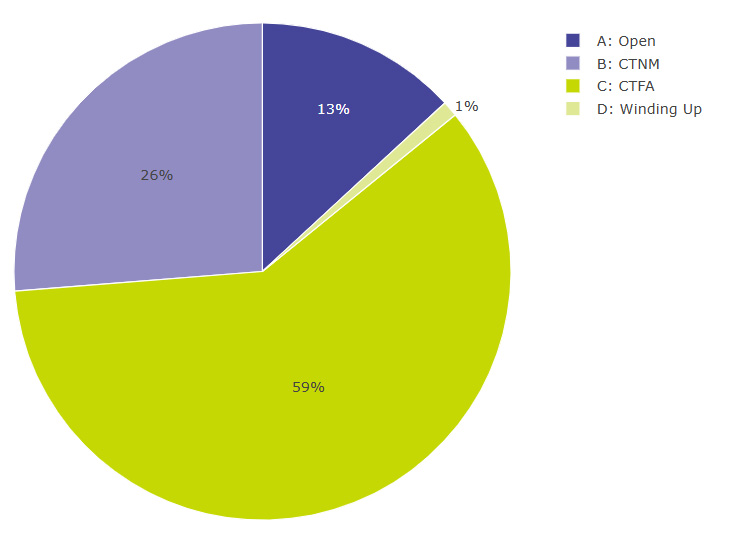
Figure 2.1 displays the distribution of private scheme membership by scheme status, with 59% in schemes closed to future accruals (CTFA), 26% in schemes closed to new members (CTNM), 13% open and 1% winding up.
Figure 2.2: Distribution of membership by status and year
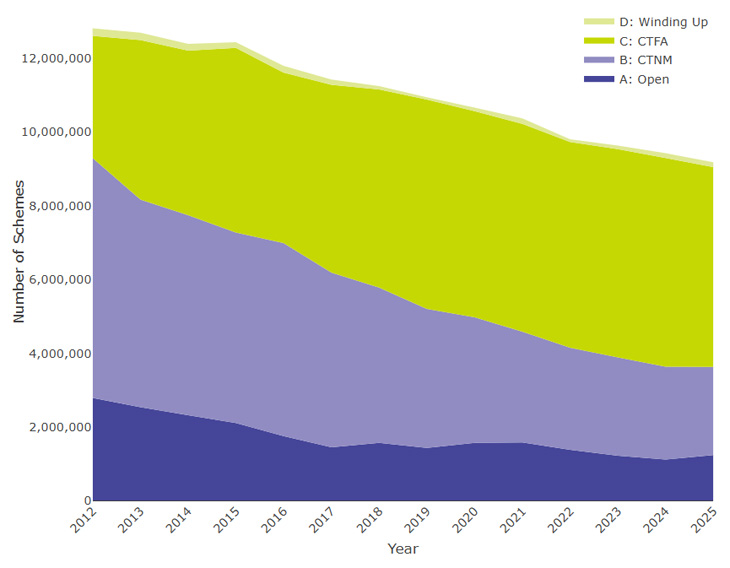
Figure 2.2 shows a decline in the total number of memberships since 2012, with 9,174,000 memberships remaining today (a decrease of 3% since 2024). The closed to future accruals category has decreased this year for the first time (from 5,656,000 in 2024 to 5,413,000 in 2025).
Figure 2.3: Membership by type and year
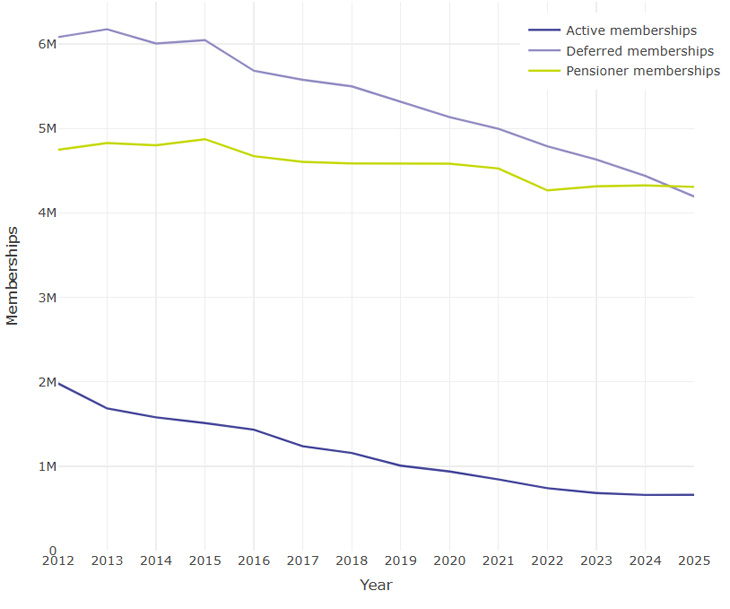
Figure 2.3 shows a decline in deferred memberships from 6,082,000 in 2012 to 4,195,000 in 2025. There are approximately equal pensions members than deferred members in private schemes in 2025: 47% of members are pensioners and 46% are deferred. Finally, the number of active memberships has been decreasing slowly but constantly, with a total number of 662,000 in 2025 (from 1,980,000 in 2012).
Table 2.4: Number of memberships by membership group and membership type
| Member group | Active | Deferred | Pensioner |
|---|---|---|---|
| A: 2 - 99 | 2,000 | 32,000 | 47,000 |
| B: 100 - 999 | 21,000 | 346,000 | 380,000 |
| C: 1,000 - 4,999 | 63,000 | 703,000 | 736,000 |
| D: 5,000 - 9,999 | 73,000 | 467,000 | 540,000 |
| E: 10,000 + | 502,000 | 2,647,000 | 2,606,000 |
| Total | 662,000 | 4,195,000 | 4,308,000 |
Table 2.4 shows that very large schemes (10,000+ members) account for the majority of memberships: 76% of active, 63% of deferred and 60% of pensioner members.
Table 2.5: Proportion of membership by status and principal employer type (% by status)
| Principal employer type | A: Open | B: CTNM | C: CTFA | D: Winding up | Total |
|---|---|---|---|---|---|
| Private limited company | 18% | 21% | 60% | 2% | 100% |
| Public limited company | 1% | 26% | 71% | 1% | 100% |
| Registered charity | 20% | 13% | 66% | 1% | 100% |
| Limited liability partnership | 0% | 1% | 97% | 2% | 100% |
| College or education institution | 70% | 23% | 7% | 0% | 100% |
| Partnership | 0% | 40% | 51% | 9% | 100% |
| Overseas company | 0% | 9% | 86% | 5% | 100% |
| Other | 20% | 24% | 56% | 1% | 100% |
Table 2.5 displays the distribution of membership by status and employer types. Education institutions have most of their memberships in open schemes, while most of the other employer’s membership belong to closed to future accruals (CTFA) schemes.
Table 2.6: Proportion of membership by principal employer type and status (% by employer type)
| Principal employer type | A: Open | B: CTNM | C: CTFA | D: Winding up |
|---|---|---|---|---|
| Private limited company | 70% | 50% | 52% | 63% |
| Public limited company | 2% | 39% | 38% | 31% |
| Registered charity | 3% | 1% | 2% | 1% |
| Limited liability partnership | 0% | 0% | 1% | 1% |
| College or education institution | 15% | 3% | 0% | 0% |
| Partnership | 0% | 0% | 0% | 0% |
| Overseas company | 0% | 0% | 0% | 1% |
| Other | 10% | 7% | 6% | 3% |
| Total | 100% | 100% | 100% | 100% |
Table 2.6 shows which employer types have the most memberships in each status category. Overall, the private limited company category accounts for the biggest number of memberships, with values ranging from 50% to 70%.
Section 3: Technical provisions funding position
This section examines TPs funding positions, including assets, TPs liabilities and surplus (or deficit) across different variables such as status and membership group.
Figure 3.1: Estimated TPs funding figures as at 31 March 2025 for schemes in surplus and deficit by scheme status (excludes schemes winding up)
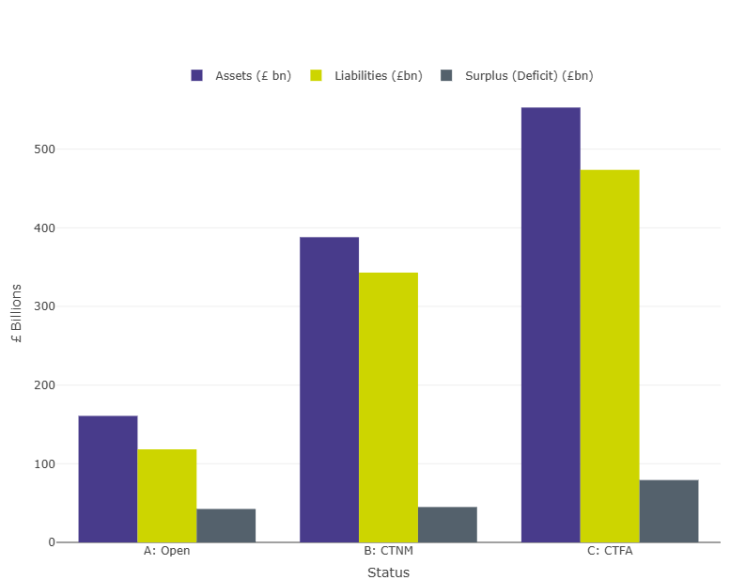
Figure 3.1 presents the estimated TPs funding figures, including estimated assets, liabilities, and surplus, for open, closed to new members (CTNM), and closed to future accruals (CTFA) schemes. The closed to future accruals schemes hold the largest amount of assets, totalling £553 billion. In comparison, closed to new members schemes have £388 billion in assets, while open schemes possess £161 billion.
Data for Figure 3.1: Estimated funding figures as at 31 March 2025 for schemes in surplus and deficit by scheme status (excludes schemes winding up)
| Status | Assets (£bn) | Technical provisions liabilities (£bn) | Surplus (Deficit) (£bn) |
|---|---|---|---|
| A: Open | 161 | 118 | 43 |
| B: CTNM | 388 | 343 | 45 |
| C: CTFA | 553 | 474 | 79 |
| Total | 1,102 | 935 | 167 |
| Total (2024) | 1,228 | 1,040 | 188 |
Data for figure 3.1 shows that total assets have reduced from £1228 billion in 2024 to £1102 billion in 2025 (a 10.3% reduction). TPs liabilities have reduced from £1040 billion to £935 billion in 2025 (a 10.1% reduction). This means the funding level has stayed the same at 118% in 2025.
Table 3.2: Number of schemes by estimated funding level as at 31 March 2025 and status (excludes schemes winding up) with a comparison to overall total for 31 March 2024
** - count suppressed. Any counts less than 5 are suppressed.
| Technical provisions funding level group | |||||
|---|---|---|---|---|---|
| Status | Less than 60% | 60% to less than 80% | 80% to less than 100% | 100% or greater | Total |
| A: Open | ** | ** | 10 | 150 | 160 |
| B: CTNM | ** | 10 | 120 | 780 | 910 |
| C: CTFA | 40 | 110 | 550 | 2,930 | 3,630 |
| Total | 40 | 120 | 680 | 3,860 | 4,700 |
| Total (2024) | 40 | 160 | 760 | 3,910 | 4,870 |
Table 3.2 shows that 3,860 schemes have 100% or greater funding in 2025. The percentage of schemes in TPs surplus is broadly the same: 82% in 2025, and 80% in 2024.
Figure 3.3: Estimated TPs funding figures as at 31 March 2025 by membership group (excludes schemes winding up)
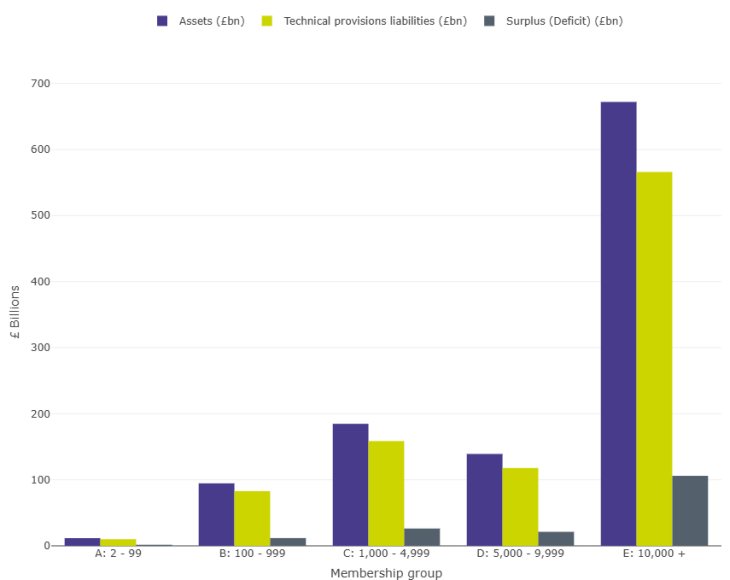
Figure 3.3 shows a high number of assets, TPs liabilities and surplus for very large schemes (E:10,000 +) with a total of £672 billion in assets, surpassing by a considerable amount the other groups which all combined just reach up to £430 billion in assets.
Table 3.4: Number of schemes by membership group and estimated funding level group (by TPs) as at 31 March 2025 (excludes schemes winding up) with a comparison to overall total for 31 March 2024
** - count suppressed. Any counts less than 5 are suppressed.
| Technical provisions funding level group | |||||
|---|---|---|---|---|---|
| Membership group | Less than 60% | 60% to less than 80% | 80% to less than 100% | 100% or greater | Total |
| A: 2 - 99 | 20 | 40 | 150 | 1,510 | 1,720 |
| B: 100 - 999 | 20 | 60 | 360 | 1,610 | 2,050 |
| C: 1,000 - 4,999 | ** | 10 | 130 | 490 | 630 |
| D: 5,000 - 9,999 | ** | ** | 20 | 120 | 140 |
| E: 10,000 + | ** | ** | 20 | 140 | 160 |
| Total | 40 | 120 | 680 | 3,860 | 4,700 |
| Total (2024) | 40 | 150 | 760 | 3,910 | 4,860 |
Section 4: Public service DB schemes
Section 4 examines the status of public service DB schemes in 2025 regarding memberships and status.
Figure 4.1: Balance of membership types in public service schemes
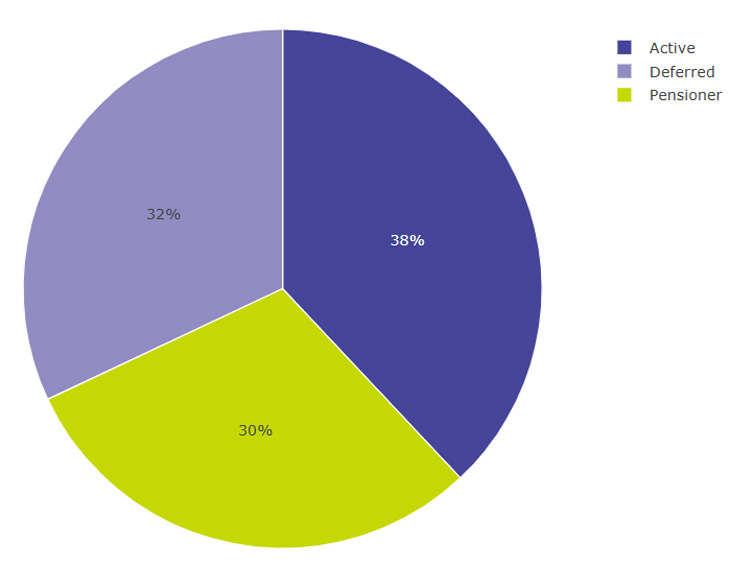
The pie chart outlines the distribution of membership types in public service DB schemes. A total of 38% are active, 32% are deferred, and 30% are pensioner members.
Figure 4.2: Comparison of balance of membership types – public service and private DB/hybrid
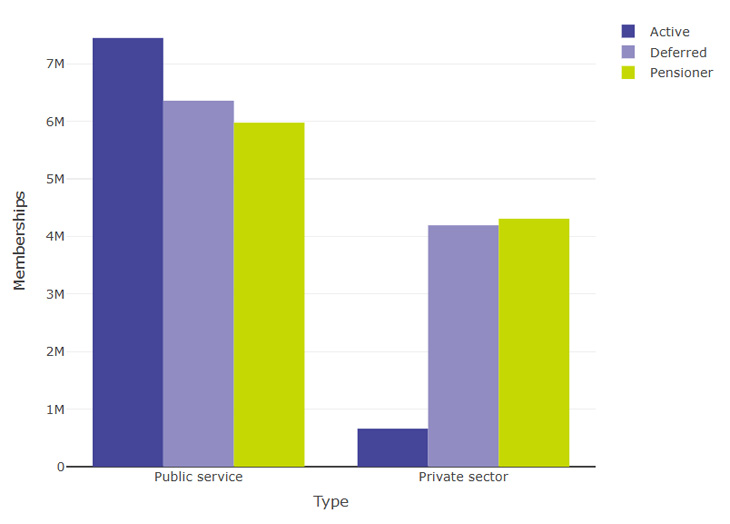
Figure 4.2 shows there are 8,110,000 active DB memberships, and 92% belong to the public service. There are 10,553,000 deferred memberships, with 60% of them in the public service and 40% in the private sector. Finally, there are 10,286,000 pensioner memberships, with 58% in to the public service and 42% in the private sector.
Using this publication
Data sources
The data used to produce our official statistics is collected from all occupational DB and hybrid schemes, via our DB and hybrid scheme returns. This publication uses data as at 31 March 2025. Schemes are required to submit their returns by 31 March annually. For membership statistics, the data relates to each scheme’s own effective date, which falls in the 2024/2025 financial year.
The scheme return includes private and public service DB and hybrid schemes. Private schemes in scope have:
- more than one member eligible for the (PPF) and/or
- are subject to the Pensions Act 2004 Part 3 scheme specific funding regime as of 31 March 2025 and/or
- are in the process of winding up
There are 5,062 private schemes in scope. Where a scheme is sectionalised or segregated, each section is treated as if it were a separate scheme for this report.
There are 21 public service pension schemes in scope. We treat each of the locally administered sections as a separate scheme and therefore regard the public service landscape as having 204 schemes.
Statistics for “TPs funding” only covers 94% of the entire private scheme population. Schemes excluded are not required to submit TPs funding valuations as they meet one of the following criteria:
- They are in the process of winding up.
- They are not yet liable to submit a TPs valuation.
- Data required for funding calculations is missing.
This publication is not directly comparable with the PPF’s Purple Book, which includes only those schemes eligible for the PPF.
Individuals may appear in membership counts multiple times due to having pension entitlements across different schemes.
Methodology
These statistics report on administrative data and actuarial data derived from it. Accuracy is addressed by eliminating data errors as far as possible. Potential sources of error include the following:
- Schemes entering data incorrectly as part of their scheme return.
- Mistakes in the programming code used to analyse the data and produce the statistics, and by analysts interpreting the data incorrectly.
Throughout this publication we have rounded scheme numbers to the nearest 10, memberships to the nearest 1,000, financial figures to the nearest million, and percentage figures to the nearest whole percentage. For this reason, the sum of figures may not equate to the total values.
Technical provisions funding position
The funding figures in this publication represent estimated assets and TPs liabilities of private sector occupational DB schemes, using standard actuarial techniques to adjust both assets and liabilities from their most recent actuarial valuation to a common date of 31 March 2025. For more information, please visit Annual Funding Statement analysis document (headed “Modelling methodology”).
The model tracks the effect of changed market conditions between these two dates on a consistent basis for all schemes. This basis is reviewed regularly. It does not consider any other changes to a scheme’s asset and liability profile due to scheme-specific experience, demographic changes (excluding changes to the underlying CMI mortality projections model), curtailments, settlements, changes in asset strategy (the model assumes the latest scheme return asset allocations apply over the whole of the inter-valuation period), scheme-specific investment performance, contingent assets, or covenant support. In particular, the change in liability-driven investment values over 2022 may not be fully recognised in the model.
Scheme status data validation
There are four ordered validation steps applied to private sector DB and hybrid scheme statuses:
- Step 1: for mixed hybrid schemes that have identified that they will not accept new members who would accrue a DB entitlement, we have adjusted the status to 'closed to new members'.
- Step 2: where a scheme states it is open or closed to new members but has no active DB members and no active liabilities, the status is adjusted to 'closed to future accruals'.
- Step 3: where a scheme states it is closed to future accrual but has active DB members and active liabilities, the status is adjusted to 'closed to new members'.
- Step 4: where a scheme states it is open but has had declining total membership over the previous three years, the status is adjusted to 'closed to new members'.
In all other cases, statuses are taken to be as submitted by the scheme. 1,379 schemes have had their status changed as part of the validation methodology.
For schemes that are classified as closed to future accrual, any memberships classified as 'active' have been reclassified as 'deferred'.
Contact
If you have a specific enquiry about our DB and hybrid schemes 2025 Official Statistics, please contact: evidenceandinsight@tpr.gov.uk.
Glossary
Accrual
Accrual is the build-up of an active scheme member’s pension benefits or entitlements in a DB pension scheme.
Active members
In a DB scheme, these are members of the scheme who are current employees and accruing benefits.
Actuarial or funding valuation
A comparison by the actuary of the value placed on scheme assets with the TPs and an assessment of any future contribution requirement. Calculating the TPs is usually based on full member-by-member data.
Closed to future accrual (CTFA)
Where existing members can no longer accrue new years of service and no new members can join.
Closed to new members (CTNM)
Schemes in which existing members continue to accrue benefits but no new members can join.
Deferred members
Deferred members are members of pension schemes who have accrued rights to pensions that will come into payment in the future but who are no longer accruing benefits in the scheme. Also known as members with preserved pension entitlements.
Defined benefit (DB)
A defined benefit (DB) pension is one in which the rules of the scheme specify the rate of benefits to be paid. The most common DB scheme is a final salary scheme in which the benefits are based on the number of years of pensionable service, the accrual rate and the final salary. An alternative to the final salary scheme is the Career Average Revalued Earnings (CARE) scheme, which is also a DB scheme.
Effective date (valuation date)
An actuarial valuation or an actuarial report considers the funding of a scheme at a particular date, known as the effective date. The effective date will be earlier than the date on which calculations are done. The effective date of a scheme’s first TPs valuation cannot be before 22 September 2005.
Funded (or unfunded) scheme
A funded scheme is one in which benefits are met from a fund built up in advance from contributions and investment income. These schemes have assets, even if they are not sufficient to meet all their liabilities, by contrast with unfunded schemes, where liabilities are not underpinned by assets.
Hybrid scheme
A hybrid scheme is an occupational pension scheme where members have either a choice, or mixture, of DB and DC pension entitlements. In a ‘pure’ hybrid arrangement, members receive benefits that are a mixture of DB and DC. In a ‘mixed hybrid’ scheme, there are separate DB and DC groups of members (often organised in separate sections of the scheme).
Occupational pension schemes
An occupational pension scheme is an arrangement (other than accident or permanent health insurance) organised by an employer (or on behalf of a group of employers) to provide benefits for employees on their retirement and for their dependents on their death. They are a form of workplace pension. Occupational pension schemes for private sector employees are also referred to as trust-based schemes.
Open
Where new members can join the DB section of the scheme and accrue benefits.
Pensioner members
Pensioner members are members of pension schemes who are receiving pensions or income withdrawals, sometimes known as beneficiaries.
Pension Protection Fund (PPF)
A corporate body established under the Pensions Act 2004. The PPF was set up to provide compensation to members of eligible DB pension schemes when there is a qualifying failure event in relation to the employer, and where there are insufficient assets in the pension scheme to cover the PPF level of compensation.
Public service pension schemes
These are pension schemes within the meaning defined in Section 318 of the Pensions Act 2004. These are schemes established under the Public Service Pensions Act 2013, new public body pension schemes and other statutory pension schemes which are connected to those schemes. It does not apply to schemes in the wider public sector, or any scheme that is excluded from being a public service pension scheme within the meaning of the Pensions Act 2004. Substantially, these are the schemes providing pension benefits for civil servants, the judiciary, local government workers, teachers, health service workers, fire and rescue workers, members of police forces and the armed forces. This includes unfunded pension schemes.
Schemes winding up
Schemes winding up are defined as such if previously informed to us via Exchange. For more information, please visit Winding up your DB scheme.
Technical provisions (TPs)
These are the liabilities or funding measure used for the purposes of TPs valuations (see below). The TPs are a calculation undertaken by the actuary of the assets needed at any particular time to make provision for benefits already considered accrued under the scheme using assumptions prudently chosen by the trustees – in other words, what is required for the scheme to meet the statutory funding objective. These include pensions in payment (including those payable to survivors of former members) and benefits accrued by other members and beneficiaries, which will become payable in the future.
Technical provisions valuation or scheme funding valuation
This is an actuarial valuation meeting the requirements of Part 3 of the Pensions Act 2004 concerning the funding of DB pension liabilities, which apply to any actuarial valuation received by trustees (on or after 30 December 2005) that is based on an effective date of 22 September 2005 or later.